
Page 101 - DeferredComp-May2018
P. 101
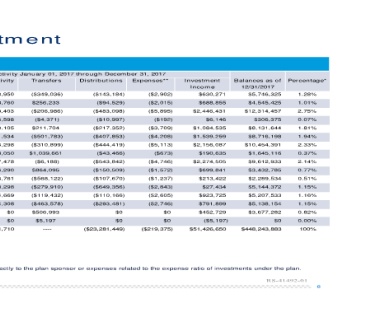
tment

ctivity January 01, 2017 through Decem ber 31, 2017

ti vi ty  Tr an sfer s   Distributions Expenses**                      Investm ent             Balances as of                  Per cen tag e*
                                                                           Incom e                  12/ 31/ 2017
0, 950     ($349, 036)         ($143, 184)              ($2, 902)                $630, 271               $5, 746, 325                 1. 28%
3, 760      $256, 233             ($94, 529)            ($2, 015)                $688, 855               $4, 545, 425                 1. 01%
0, 403     ($206, 986)                                  ($5, 895)            $2, 446, 431             $12, 314, 457                   2. 75%
5, 598                         ($483, 098)                                            $6, 146                $306, 375                0. 07%
0, 105        ($4, 371)           ($10, 997)                ($192)           $1, 084, 535                $8, 131, 644                 1. 81%
1, 534      $211, 704                                   ($3, 709)            $1, 539, 259                $8, 716, 198                 1. 94%
5, 298     ($501, 783)         ($217, 352)              ($4, 208)            $2, 156, 087             $10, 454, 391                   2. 33%
3, 050     ($310, 899)         ($407, 853)              ($5, 113)                $190, 635               $1, 645, 116                 0. 37%
7, 478    $1, 039, 661         ($444, 419)                                   $2, 274, 505                $9, 612, 933                 2. 14%
6, 290                                                      ($673)               $699, 841               $3, 432, 785                 0. 77%
6, 761        ($6, 188)           ($43, 466)            ($4, 746)                $213, 422               $2, 289, 534                 0. 51%
3, 298      $864, 095          ($543, 842)              ($1, 572)                  $27, 434              $5, 144, 372                 1. 15%
4, 669     ($568, 122)         ($150, 509)              ($1, 237)                $923, 725               $5, 207, 533                 1. 16%
4, 308     ($279, 910)         ($107, 670)              ($2, 843)                $791, 899               $5, 138, 154                 1. 15%
           ($119, 432)         ($649, 356)              ($2, 605)                $452, 729               $3, 677, 282                 0. 82%
      $0   ($463, 578)         ($110, 166)              ($2, 746)                   ($5, 197)                              $0         0. 00%
      $0    $506, 993          ($293, 481)                                $51, 426, 650             $448, 243, 883                     100%
1, 710                                                             $0
              $5, 197                          $0                  $0
                   ----                        $0  ($219, 375)
                         ($23, 281, 449)

ectly to the plan sponsor or expenses related to the expense ratio of investments under the plan.

                                                                                               RS-41492-01

                                                                                                                               8