
Page 24 - DeferredComp-May2018
P. 24
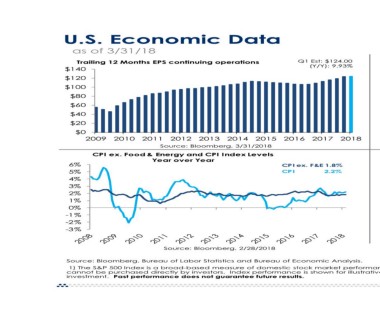
U.S. Economic Data

   as of 3/31/18

       Trailing 12 Months EPS continuing operations                Q1 Est: $124.00
$140                                                                       (Y/Y): 9.93%

$120

$100

$80
$60

$40
$20

$0         2010  2011 2012 2013 2014 2015                    2016  2017  2018
     2009
                              Source: Bloomberg, 3/31/2018

 6%   CPI ex. Food & Energy and CPI I ndex Levels
 5%                                          Year over Year
 4%
 3%                                                          CP I ex. F &E 1.8%
 2%
 1%                                                          CP I  2.2%
 0%
-1 %
-2 %
-3 %

                                                                        Source: Bloomberg, 2/28/2018

Source: Bloomberg, Bureau of Labor Statistics and Bureau of Economic Analysis.
 1) The S&P 500 Index is a broad-based measure of domestic stock market performan

cannot be purchased directly by investors. Index performance is shown for illustrative
investment. Past performance does not guarantee future results.