
Page 297 - DCAC February 2024 Files
P. 297
High Low
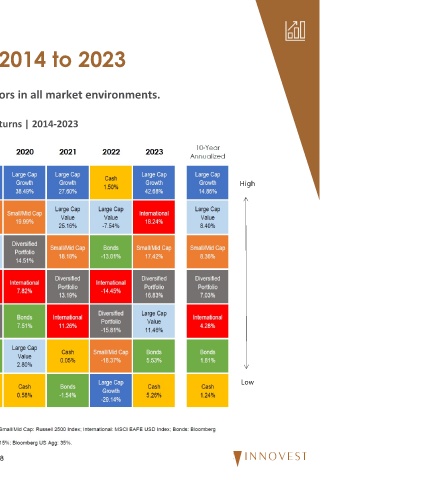
Diversification is an effective tool for patient investors in all market environments.
2023 U.S. Equity 26% Midstream Energy 24% Int'l Equity 18% Diversified Portfolio 17% REITs 16% Emerging Markets 10% Hedge Funds 6% U.S. Fixed Income 6%
Periodic Table of Returns, 2014 to 2023
Midstream Hedge Funds Diversified U.S. Fixed Int'l Equity Emerging
2022 Energy 31% -5% Portfolio -12% Income -13% -14% U.S. Equity -19% Markets -20% REITs -27%
Periodic Table of Returns | 2014‐2023
2021 REITs 46% Midstream Energy 41% U.S. Equity 26% Diversified Portfolio 17% Int'l Equity 11% Hedge Funds 7% U.S. Fixed Income -2% Emerging Markets -3%
U.S. Equity Emerging Diversified Hedge Funds Int'l Equity U.S. Fixed Midstream
2020 21% Markets 18% Portfolio 10% 10% 8% Income 8% REITs -8% Energy -31% 18
2019 U.S. Equity 31% REITs 26% Int'l Equity 22% Diversified Portfolio 19% Emerging Markets 18% U.S. Fixed Income 9% Hedge Funds 8% Midstream Energy 7% U.S. Equities: Russell 3000, MLPs: Alerian MLP Infrastructure, Real Estate: Wilshire US REIT, U.S. Fixed Income: Bloomberg US Agg, Int'l Equity: MSCI EAFE, Emerging Markets: MSCI EM, Hedge Funds: HFRI Fund of Funds
2018 U.S. Fixed Income 0% Hedge Funds -3% REITs -5% U.S. Equity -5% Diversified Portfolio -6% Midstream Energy -12% Int'l Equity -14% Emerging Markets -15%
Emerging Markets 37% Int'l Equity 25% U.S. Equity 21% Diversified Portfolio 14% Hedge Funds 8% REITs 4% U.S. Fixed Income 4% Midstream Energy -9%
Midstream Emerging Diversified U.S. Fixed Hedge
2016 Energy 19% U.S. Equity 13% Markets 11% Portfolio 8% REITs 7% Income 3% Int'l Equity 1% Funds 1%
2015 REITs 4% U.S. Fixed Income 1% U.S. Equity 0% Hedge Funds 0% Int'l Equity -1% Diversified Portfolio -3% Emerging Markets -15% Midstream Energy -32% Source: Innovest Portfolio Solutions and Morningstar Direct.
2014 REITs 32% U.S. Equity 2017 13% Midstream Energy 8% Diversified Portfolio 7% U.S. Fixed Income 6% Hedge Funds 3% Emerging Markets -2% Int'l Equity -5%
High Low