
Page 314 - DCAC February 2024 Files
P. 314
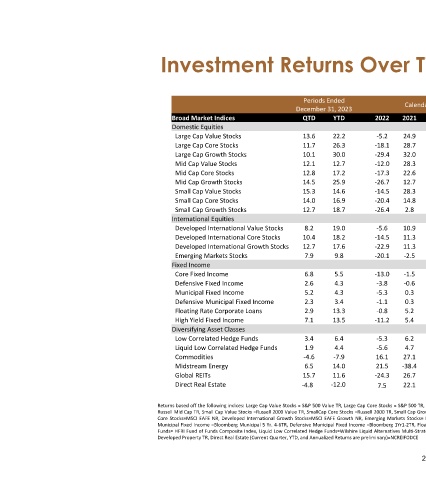
Annualized Periods Ended December 31, 2023
                         Calendar Year Returns
                 Investment Returns Over Time
                            2022  20 yrs  10 yrs  7 yrs  5 yrs  3 yrs  1 yr  2018  2019  2020  2021  8.5  10.0  10.7  14.1  13.1  22.2  ‐9.0  31.9  1.4  24.9  ‐5.2  9.7  12.0  13.4  15.7  10.0  26.3  ‐4.4  31.5  18.4  28.7  ‐18.1  10.5  13.4  15.3  16.2  6.6  30.0  0.0  31.1  33.5  32.0  ‐29.4  9.3  8.3  7.8  11.2  8.4  12.7  ‐12.3  27.1  5.0  28.3  ‐12.0  9.8  9.4  10.1  12.7  5.9  17.2  ‐9.1  30.5  17.1  22.6  ‐17.3  10.2  10.


                        Periods Ended   December 31, 2023  YTD  QTD  22.2  13.6  26.3  11.7  30.0  10.1  12.7  12.1  17.2  12.8  25.9  14.5  14.6  15.3  16.9  14.0  18.7  12.7  19.0  8.2  18.2  10.4  17.6  12.7  9.8  7.9  5.5  6.8  4.3  2.6  4.3  5.2  3.4  2.3  13.3  2.9  13.5  7.1  6.4  3.4  4.4  1.9  ‐7.9  ‐4.6  14.0  6.5  11.6  15.7  -12.0  -4.8  Developed Property TR, Direct Real Estate (Current Quarter, YTD, and Annualized


                            Broad Market Indices  Domestic Equities  Large Cap Value Stocks  Large Cap Core Stocks Large Cap Growth Stocks  Mid Cap Value Stocks  Mid Cap Core Stocks  Mid Cap Growth Stocks  Small Cap Value Stocks  Small Cap Core Stocks Small Cap Growth Stocks  International Equities Developed International Value Stocks Developed International Core Stocks Developed International Growth Stocks Emerging Markets Stoc