
Page 376 - DCAC February 2024 Files
P. 376
36.0
30.0
Risk (Standard Deviation %)
24.0
(5 YEARS*)
18.0
12.0
RISK VS. RETURN
6.0
16.0
20.0
0.0
8.0
12.0
4.0
Return (%)
Years
10
Years
7
Years
5
Years
3
(37) Standard Return Deviation (44) 7.32 (43) 7.45 (64) 10.07 (86) 2.32 24.01 10.07 Fidelity Small Cap Index (50) 7.16 (46) 7.33 (67) 9.97 (87) 2.22 (40) 24.02 9.97 Russell 2000 Index 23.87 10.85 Median 7.15 7.19 10.85 7.27 2016 2017 2018 2019 2020 2021 (51) 21.63 (20) 14.85 (29) -10.88 (30) 25.71 (11) 19.99 (90) 14
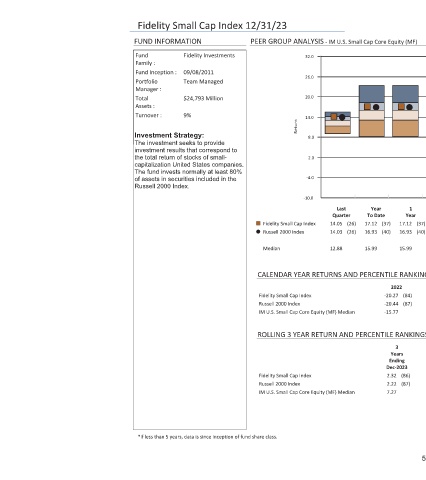
PEER GROUP ANALYSIS - IM U.S. Small Cap Core Equity (MF)
1 Year 17.12 16.93 15.99 (84) (87) (86) (87)
2022 3 Years Ending Dec-2023
(37) (40) -20.27 -20.44 -15.77 2.32 2.22 7.27
Year To Date 17.12 16.93 15.99
(26) (26)
Last Quarter 14.05 14.03 12.88 CALENDAR YEAR RETURNS AND PERCENTILE RANKINGS ROLLING 3 YEAR RETURN AND PERCENTILE RANKINGS
32.0 26.0 20.0 14.0 Return 8.0 2.0 -4.0 -10.0 Fidelity Small Cap Index Russell 2000 Index Median Fidelity Small Cap Index Russell 2000 Index IM U.S. Small Cap Core Equity (MF) Median Fidelity Small Cap Index Russell 2000 Index IM U.S. Small Cap Core Equity (MF) Median
Fidelity Small Cap Index 12/31/23 FUND INFORMATION Fidelity Investments Fund Family : 09/08/2011 Fund Inception : Team Managed Portfolio Manager : $24,793 Million Total Assets : 9% Turnover : Investment Strategy: The investment seeks to provide investment results that correspond to the total return of stocks of small- capitalization United States companies. The fund invests normally at least 80% of assets in s