
Page 105 - DCAC May 2024 Files
P. 105
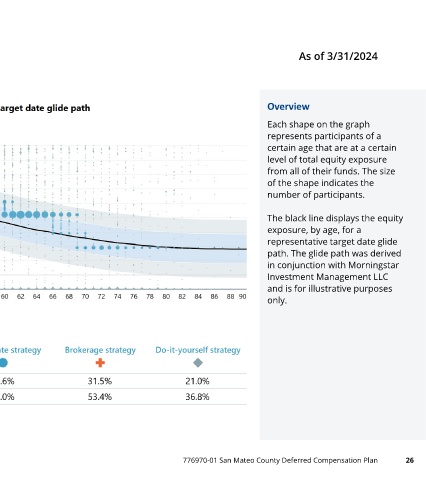
Equity exposure                                                    As of 3/31/2024


                                                             Overview

                                                             Each shape on the graph
                                                             represents participants of a
                                                             certain age that are at a certain
                                                             level of total equity exposure
                                                             from all of their funds. The size
                                                             of the shape indicates the
                                                             number of participants.


                                                             The black line displays the equity
                                                             exposure, by age, for a
                                                             representative target date glide
                                                             path. The glide path was derived
                                                             in conjunction with Morningstar
                                                             Investment Management LLC
                                                             and is for illustrative purposes
                                                             only.


 FOR FINANCIAL PROFESSIONAL AND PLAN SPONSOR USE ONLY. ©2024 EMPOWER, LLC. ALL RIGHTS RESERVED.  776970-01 San Mateo County Deferred Compensation Plan  26