
Page 343 - DCAC Feb 2026 Files
P. 343
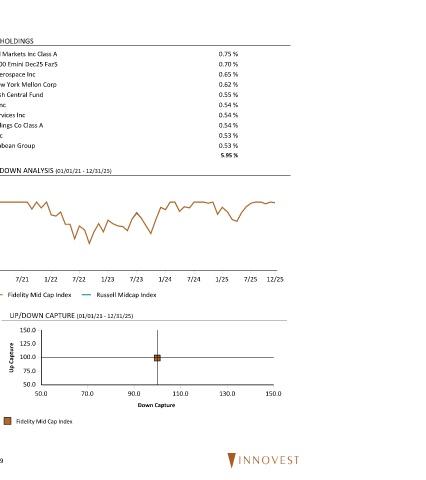
Fidelity Mid Cap Index 12/31/25
     PORTFOLIO CHARACTERISTICS  TOP 10 HOLDINGS
 Total Securities  816  Robinhood Markets Inc Class A  0.75 %
 Avg. Market Cap  $23,811 Million  S&P Mid 400 Emini Dec25 Faz5  0.70 %
 P/E  17.42  Howmet Aerospace Inc                 0.65 %
 P/B  2.60  Bank of New York Mellon Corp          0.62 %
 Div. Yield  1.72%  Fidelity Cash Central Fund    0.55 %
 Cummins Inc                                      0.54 %
 Quanta Services Inc                              0.54 %
 Vertiv Holdings Co Class A                       0.54 %
 Cencora Inc                                      0.53 %
 Royal Caribbean Group                            0.53 %
 Total                                             5.95 %
 SECTOR ALLOCATION        DRAWDOWN ANALYSIS (01/01/21 - 12/31/25)
 10.0
 Materials  3.8%
 Communication Services  4.0%  0.0
 Consumer Staples
 4.7%
 Energy  5.9%  -10.0
 Utilities  6.3%
 Real Estate  7.2%  -20.0
 Health Care  10.5%
 Consumer Discretionary  12.3%  -30.0
 Financials  13.6%
 -40.0
 Information Technology  15.1%
 Industrials  16.8%  1/21  7/21  1/22  7/22  1/23  7/23  1/24  7/24  1/25  7/25  12/25
 0.0%  6.0%  12.0%  18.0%  24.0%  Fidelity Mid Cap Index  Russell Midcap Index

 STYLE MAP (10/01/11 - 12/31/25)  UP/DOWN CAPTURE (01/01/21 - 12/31/25)
     150.0
 Large Cap Value  Large Cap Growth  125.0
 Capitalization  Up Capture     100.0


      75.0
      50.0
 Small Cap Value  Small Cap Growth
         50.0      70.0       90.0      110.0     130.0      150.0
 Manager Style                  Down Capture
 Style History  Dec-2025  Average Style Exposure  Fidelity Mid Cap Index


 49