
Page 357 - DCAC Feb 2026 Files
P. 357
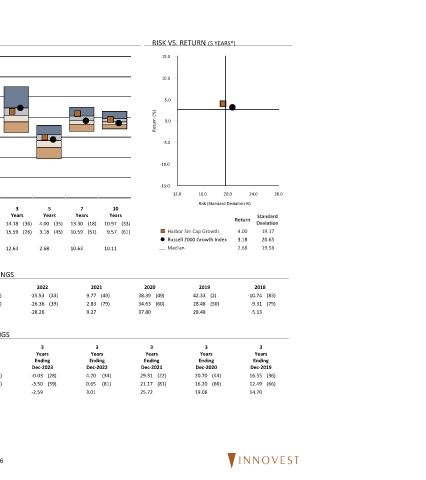
Harbor Sm Cap Growth 12/31/25
FUND INFORMATION PEER GROUP ANALYSIS - Small Growth RISK VS. RETURN (5 YEARS*)
Fund Harbor 36.0 15.0
Family:
Fund Inception: 11/01/2000
Portfolio Team Managed 28.0 10.0
Manager:
Total 2,132 Million
Assets: 20.0 5.0
Turnover 106.00 %
12.0 Return (%) 0.0
Firm and Management: Return
Harbor Capital employs a manager-of- 4.0
managers approach to identifying -5.0
independent, boutique managers that
they believe have an identifiable edge -4.0
in their respective asset classes. -10.0
Headquartered in Boston, Mass., they
partner with 15 “hidden gem” -12.0
investment firms. -15.0
12.0 16.0 20.0 24.0 28.0
-20.0
Investment Strategy: Risk (Standard Deviation %)
Harbor Small Cap Growth has been Last Year 1 3 5 7 10
managed by Westfield Capital Quarter To Date Year Years Years Years Years Return Standard
Management Company, L.P. since late ¢ £ Harbor Sm Cap Growth 3.09 (34) 11.43 (32) 11.43 (32) 14.18 (36) 4.00 (35) 13.30 (18) 10.97 (33) Deviation
2000. Westfield looks for stocks with Russell 2000 Growth Index 1.22 (64) 13.01 (22) 13.01 (22) 15.59 (26) 3.18 (45) 10.59 (51) 9.57 (61) ¢ £ Harbor Sm Cap Growth 4.00 19.17
market caps between $300 million and Russell 2000 Growth Index 3.18 20.65
$1.5 billion, earnings-growth rates of at Median 1.87 8.86 8.86 12.63 2.68 10.63 10.11 ¾ Median 2.68 19.58
least 20%, and reasonable
price/earnings multiples, although it is
flexible about those guidelines. They
come up with a price target for each CALENDAR YEAR RETURNS AND PERCENTILE RANKINGS
stock in the portfolio, and if a stock hits 2024 2023 2022 2021 2020 2019 2018
its target, they either trim the position or
raise the target. If a stock drops 20%, Harbor Sm Cap Growth 9.31 (82) 22.20 (12) -25.53 (33) 9.77 (49) 38.39 (49) 42.33 (2) -10.74 (83)
they either buy more or sell, depending Russell 2000 Growth Idx 15.15 (40) 18.66 (32) -26.36 (39) 2.83 (79) 34.63 (60) 28.48 (50) -9.31 (79)
on whether their reason for owning it is Small Growth Median 13.77 16.43 -28.26 9.27 37.80 28.48 -5.13
still valid.
Innovest's Assessment: ROLLING 3 YEAR RETURN AND PERCENTILE RANKINGS
Harbor Small Cap Growth should
outperform after market inflection 3 3 3 3 3 3 3
points, as earnings benefit from Years Years Years Years Years Years Years
operating leverage or revenue Ending Ending Ending Ending Ending Ending Ending
improvements, and when market Dec-2025 Dec-2024 Dec-2023 Dec-2022 Dec-2021 Dec-2020 Dec-2019
valuations converge with company Harbor Sm Cap Growth 14.18 (36) -0.17 (41) -0.03 (28) 4.20 (34) 29.31 (22) 20.70 (44) 16.55 (36)
specific fundamentals. The strategy Russell 2000 Growth Idx 15.59 (26) 0.21 (34) -3.50 (59) 0.65 (81) 21.17 (81) 16.20 (66) 12.49 (66)
should underperform during periods Small Growth Median 12.63 -0.97 -2.59 3.01 25.72 19.06 14.70
when "momentum" investments are
outperforming, and high valuation
stocks are on the rise.
*If less than 5 years, data is since inception of fund share class.
56