
Page 381 - DCAC Feb 2026 Files
P. 381
PIMCO Tot Rtn Inst 12/31/25
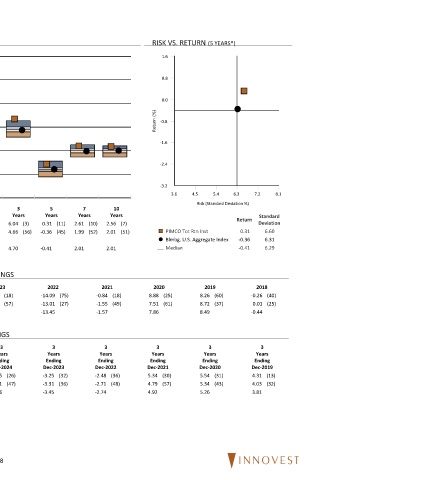
FUND INFORMATION PEER GROUP ANALYSIS - Intermediate Core Bond RISK VS. RETURN (5 YEARS*)
Fund PIMCO 14.0 1.6
Family:
Fund Inception: 05/11/1987
Portfolio Team Managed 11.0 0.8
Manager:
Total 46,776 Million 0.0
Assets: 8.0
Turnover 606.00 %
Firm and Strategy Return 5.0 Return (%) -0.8
PIMCO is a global asset
management firm headquartered in -1.6
Newport Beach, California. PIMCO 2.0
is known for their fixed-income
fund offerings and is one of the -2.4
largest fixed-income managers -1.0
globally. CEO Emmanuel Roman -3.2
has been with the firm since 2016. 3.6 4.5 5.4 6.3 7.2 8.1
-4.0
Risk (Standard Deviation %)
Investment Strategy Last Year 1 3 5 7 10
PIMCO Total Return seeks to Quarter To Date Year Years Years Years Years Return Standard
outperform the U.S. Bloomberg ¢ £ PIMCO Tot Rtn Inst 1.71 (1) 9.33 (1) 9.33 (1) 6.04 (3) 0.31 (11) 2.61 (10) 2.56 (7) Deviation
Aggregate Index by 100-150 basis Blmbg. U.S. Aggregate Index 1.10 (23) 7.30 (36) 7.30 (36) 4.66 (56) -0.36 (45) 1.99 (52) 2.01 (51) ¢ £ PIMCO Tot Rtn Inst 0.31 6.60
points per year. With macro- Blmbg. U.S. Aggregate Index -0.36 6.31
economic forecasts set at the firm Median 0.99 7.14 7.14 4.70 -0.41 2.01 2.01 ¾ Median -0.41 6.29
level, the team uses bottom-up
analysis to establish portfolio
position on many factors such as CALENDAR YEAR RETURNS AND PERCENTILE RANKINGS
the yield curve, interest rates, and
security selection. 2024 2023 2022 2021 2020 2019 2018
PIMCO Tot Rtn Inst 2.61 (10) 6.30 (18) -14.09 (75) -0.84 (18) 8.88 (25) 8.26 (60) -0.26 (40)
Innovest Assessment Blmbg. U.S. Aggregate Index 1.25 (69) 5.53 (57) -13.01 (27) -1.55 (49) 7.51 (61) 8.72 (37) 0.01 (25)
The fund tends to favor securitized Intermediate Core Bond Median 1.50 5.59 -13.45 -1.57 7.86 8.49 -0.44
and government bonds. This helps
protect investors during market
drawdowns by reducing risk in the ROLLING 3 YEAR RETURN AND PERCENTILE RANKINGS
portfolio. However, this same tilt 3 3 3 3 3 3 3
may cause the portfolio to lag Years Years Years Years Years Years Years
when credit markets are strong. Ending Ending Ending Ending Ending Ending Ending
Dec-2025 Dec-2024 Dec-2023 Dec-2022 Dec-2021 Dec-2020 Dec-2019
PIMCO Tot Rtn Inst 6.04 (3) -2.15 (26) -3.25 (32) -2.48 (36) 5.34 (30) 5.54 (31) 4.31 (13)
Blmbg. U.S. Aggregate Index 4.66 (56) -2.41 (47) -3.31 (36) -2.71 (48) 4.79 (57) 5.34 (43) 4.03 (32)
Intermediate Core Bond Median 4.70 -2.46 -3.45 -2.74 4.92 5.26 3.81
*If less than 5 years, data is since inception of fund share class.
68