
Page 481 - DCAC Feb 2026 Files
P. 481
CONTRIBUTIONS BY RACE/ETHNICITY – 2024 vs 2025
$9,913 WOMEN'S TRENDS
White $10,243
$9,443
$9,684
$8,707
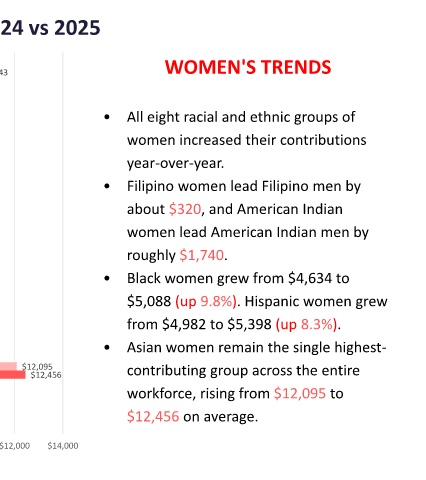
$9,240 • All eight racial and ethnic groups of
Two or More Races
$5,640
$6,576 women increased their contributions
$6,146 year-over-year.
Native Hawaiian/Pac. Islander $7,558
$3,799
$3,959 • Filipino women lead Filipino men by
$6,422 about $320, and American Indian
Hispanic/Latino $6,410
$4,982
$5,398 women lead American Indian men by
$7,091 roughly $1,740.
Filipino $7,528
$7,271
$7,852 • Black women grew from $4,634 to
$6,715 $5,088 (up 9.8%). Hispanic women grew
Black/African American $6,355
$4,634
$5,088 from $4,982 to $5,398 (up 8.3%).
$9,294 • Asian women remain the single highest-
Asian $9,628
$12,095 contributing group across the entire
$12,456
workforce, rising from $12,095 to
$8,092
American Indian/Alaska Native $4,159
$5,532 $12,456 on average.
$5,900
$0 $2,000 $4,000 $6,000 $8,000 $10,000 $12,000 $14,000
Men 2024 Men 2025 Women 2024 Women 2025