
Page 14 - AugDefComp
P. 14
Quarterly Market Recap
Index Returns (%) China Japan EU U.S. 1 Year YTD Global Market Data 9.40 -8.80 -15.30 -10.30 7.51 -3.08 GDP Growth (YOY) (%) 2.70 0.00 0.50 0.40 -6.63 -12.98 CPI (YOY) (%) 4.50 2.80 8.60 13.00 -5.13 -11.34 Unemployment (%) 2.13 -0.10 0.07 0.25 -3.39 -9.78 Central Bank Rate (Level) 2.85 0.03 0.21 0.66 26.94 12.67 10 Year Govt. Yield (%) *Forecasted Q2 2020 1 Year YTD Chart of the Quarter 8.74 6.14 9.50 5.02 0.03 -3.80 0.86 1.04 1 Year YTD -17.38 -19.40 -13.04 -18.71 28.66 17.38 -36.75 -37.65
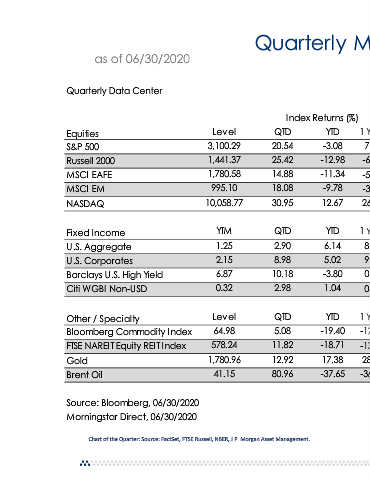
QTD 20.54 25.42 14.88 18.08 30.95 QTD 2.90 8.98 10.18 2.98 QTD 5.08 11.82 12.92 80.96
Level 3,100.29 1,441.37 1,780.58 995.10 10,058.77 YTM 1.25 2.15 6.87 0.32 Level 64.98 578.24 1,780.96 41.15 Chart of the Quarter: Source: FactSet, FTSE Russell, NBER, J.P. Morgan Asset Management.
as of 06/30/2020 Quarterly Data Center Equities S&P 500 Russell 2000 MSCI EAFE MSCI EM NASDAQ Fixed Income U.S. Aggregate U.S. Corporates Barclays U.S. High Yield Citi WGBI Non-USD Other / Specialty Bloomberg Commodity Index FTSE NAREIT Equity REIT Index Gold Brent Oil Source: Bloomberg, 06/30/2020 Morningstar Direct, 06/30/2020