
Page 83 - AugDefComp
P. 83
2
RS-41492-03
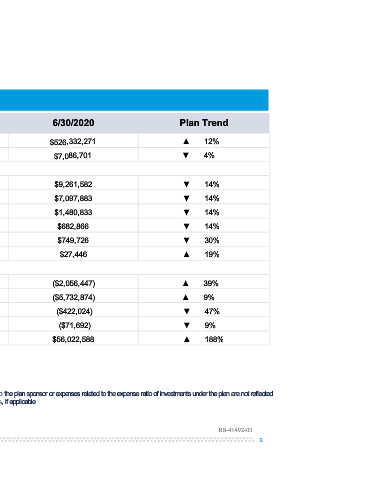
Plan Trend
▲ 12% ▼ 4% ▼ 14% ▼ 14% ▼ 14% ▼ 14% ▼ 30% ▲ 19% ▲ 39% ▲ 9% ▼ 47% ▼ 9% ▲ 188%
6/30/2020 $526,332,271 $7,086,701 $9,261,582 $7,097,883 $1,480,833 $682,866 $749,726 $27,446 ($2,056,447) ($5,732,874) ($422,024) ($71,692) $56,022,588 plan assets. Expenses billed directly to the plan sponsor or expenses related to the expense ratio of investments under the plan are not reflected.
3/31/2020 $468,447,883 $7,414,961 $10,746,921 $8,255,227 $1,765,037 $726,657 $1,064,239 $23,098 ($1,484,343) ($5,250,848) ($796,248) ($78,416) ($63,907,669) Not for use with Plan Participants.
Executive Summary
expenses deducted from Contribution data displays the combined dollar value of Contributions & Loan Repayments, if applicable. 61869-1-San Mateo County Deferred Compensation Plan For Advisor and Plan Sponsor use only. Not for use with Plan Participants.
Plan Statistics Total Plan Assets Total Outstanding Loan Balances Participant Contributions Participant EE Pre-Tax Roth Loan Repayment Rollover Transferred Assets Distributions Withdrawals Terminations Loans Expenses* Investment Income *The expenses shown reflect The For Financial Professional and Plan Sponsor use only.