
Page 127 - AugDefComp
P. 127
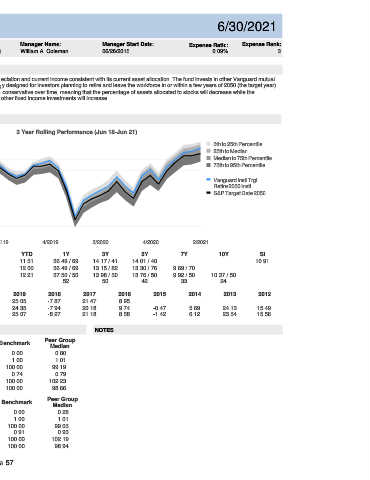
Vanguard Instl Trgt Retire 2050 Instl  VTRLX                            6/30/2021


 Fund Incep Date:      Benchmark:     Category:     Net Assets:     Manager Name:    Manager Start Date:    Expense Ratio:  Expense Rank:
 06/26/2015  S&P Target Date 2050  Target-Date 2050   $32,523.00M   William A. Coleman   06/26/2015  0.09%    3


 PORTFOLIO COMPOSITION (Holdings-based)     INVESTMENT OVERVIEW
  Assets  The investment seeks to provide capital appreciation and current income consistent with its current asset allocation. The fund invests in other Vanguard mutual
 funds according to an asset allocation strategy designed for investors planning to retire and leave the workforce in or within a few years of 2050 (the target year).
    Cash  0.23%       The fund's asset allocation will become more conservative over time, meaning that the percentage of assets allocated to stocks will decrease while the
    US Stocks  54.51%       percentage of assets allocated to bonds and other fixed income investments will increase.
    US Bonds  6.49%
    Non-US Stocks  35.78%
    Preferred Stocks  0.01%       PERFORMANCE
    Convertible Bonds  0.09%
    Other  0.03%       3 Year Rolling Performance (Jun 18-Jun 21)
    Non-US Bonds  2.86%       16
 Sector Breakdown                                                      5th to 25th Percentile
 14                                                                    25th to Median
 Sensitive
 Communication Services  9.05%  12                                     Median to 75th Percentile
                                                                       75th to 95th Percentile
 Industrials  11.14%
 10
 Technology  18.68%
                                                                       Vanguard Instl Trgt
 Energy  3.35%  8
                                                                       Retire 2050 Instl
 Cyclical  6                                                           S&P Target Date 2050
 Basic Materials  4.98%
 Consumer Cyclical  12.00%  4
 Real Estate  3.65%  2
 Financial Services  16.05%
 0
 Defensive
 Consumer Defensive  6.69%  -2
 Healthcare  11.76%  2/2018  4/2018  2/2019  4/2019  2/2020  4/2020  2/2021
 Utilities  2.65%
 3M     YTD          1Y           3Y           5Y           7Y           10Y          SI
 TOP 10 HOLDINGS
 Fund  6.64  11.51  36.49 / 69  14.17 / 41  14.01 / 40                               10.91
 Vanguard Total Stock Market Idx I  54.81%
 Benchmark  6.08  12.00  36.49 / 69  13.15 / 82  13.30 / 76  9.69 / 70
 Vanguard Total Intl Stock Index Inv  35.58%  Peer Group Median  6.65  12.21  37.50 / 50  13.98 / 50  13.76 / 50  9.92 / 50  10.37 / 50
 Vanguard Total Bond Market II Idx Inv  7.10%
 Number of Funds     52           50           42           33           24
 Vanguard Total Intl Bd II Idx Admiral  2.43%
       CALENDAR  2020  2019  2018  2017  2016      2015        2014        2013       2012
       Fund  16.33  25.05  -7.87  21.47  8.95
       Benchmark  13.86  24.35  -7.94  20.18  9.74  -0.47      5.69       24.13       15.49
       Peer Group Median  15.93  25.07  -8.27  21.18  8.58  -1.42  6.12   23.54       15.58


 RISK & PERFORMANCE STATISTICS   NOTES
 Total:  99.93%
                Peer Group
 3 Yr  Fund  Benchmark
 ASSET LOADINGS  (Returns-based)     Median
 Alpha  0.99  0.00  0.80
 FUND EXPOSURES (WEIGHT) (Jul 18-Jun 21)  Beta  0.99  1.00  1.01
 100
 75  R-Squared  99.72  100.00  99.19
 Sharpe Ratio  0.80  0.74  0.79
 50
 25  Up Market Capture  101.83  100.00  102.23
 0  Down Market Capture  97.53  100.00  98.66
 Current       Average
 Fund  Bmk   Fund   Bmk   5 Yr  Fund  Benchmark  Peer Group
 Cash  0.0   5.1   0.0   2.5   Median
 US Bonds  0.8   0.0   0.6   2.0   Alpha  0.70  0.00  0.28
 Intl Bonds  11.7   5.9   10.5   5.6   Beta  0.99  1.00  1.01
 Intl Equity  25.4   28.8   28.9   29.4   R-Squared  99.53  100.00  99.05
 US Equity  62.1   60.2   60.0   60.6   Sharpe Ratio  0.96  0.91  0.93
 Up Market Capture  101.76  100.00  102.19
 Down Market Capture  97.88  100.00  98.94

 Page 57