
Page 63 - AugDefComp
P. 63
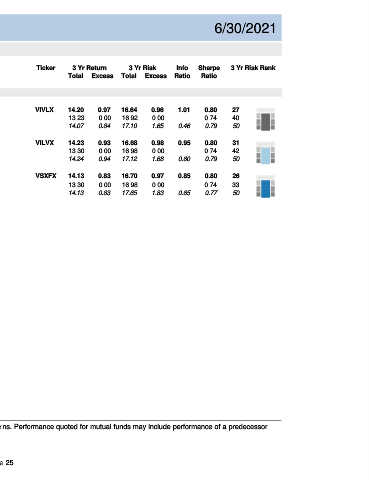
Risk Analysis                                                          6/30/2021


 Asset Class: Balanced

             Ticker      3 Yr Return        3 Yr Risk      Info    Sharpe    3 Yr Risk Rank
                        Total  Excess    Total   Excess    Ratio   Ratio


 RISK / RETURN (3-Year)

 Vanguard Instl Trgt Retire 2055 Instl  VIVLX  14.20  0.97  16.64  0.96  1.01  0.80  27
 16.0
 S&P Target Date 2055  13.23     0.00    16.92     0.00             0.74      40
 Target-Date 2055 Median (50 funds)  VILVX  14.07  0.84  17.10  1.65  0.46  0.79  50   3 Yr
 Return (Total Annualized Return, %)  8.0  S&P Target Date 2060+  VSXFX  13.30  0.00  16.98  0.00  0.60  0.74  42  3 Yr
 12.0
                                 0.93
 Vanguard Instl Trgt Retire 2060 Instl
                       14.23
                                         16.68
                                                            0.95
                                                                     0.80
                                                                              31
                                                   0.98
                                 0.94
                                                                              50
 Target-Date 2060 Median (44 funds)
                                                                     0.79
                       14.24
                                                   1.68
                                         17.12
                       14.13
                                                            0.85
                                                   0.97
                                 0.83
                                         16.70
                                                                              26
                                                                     0.80
 Vanguard Instl Trgt Retire 2065 Instl
                                                                              33
                                         16.98
                                                                    0.74
                                                   0.00
 S&P Target Date 2060+
                                 0.00
                       13.30
                                                   1.83
                                                                              50
 Target-Date 2065+ Median (5 funds)
                                                                     0.77
                                                            0.65
                       14.13
                                         17.65
                                 0.83
 4.0
 0.0                                                                                   3 Yr
 0.0  4.5  9.0  13.5  18.0
 Risk (Total Annualized StdDev, %)
 RISK / RETURN PEER RANK (3-Year)
 1
 Return Rank (Total Return Rank, %)  50
 25
 75


 100
 0.0  4.5  9.0  13.5  18.0
 Risk (Total Annualized StdDev, %)


 Past performance is no guarantee of future results. Rankings provided based on total returns. Performance quoted for mutual funds may include performance of a predecessor
 fund/share class prior to the share class commencement of operations.


 Page 25