
Page 72 - AugDefComp
P. 72
5
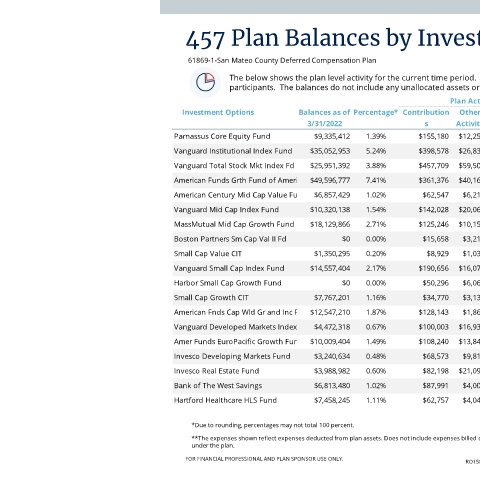
457 Plan Balances by Investment
61869-1-San Mateo County Deferred Compensation Plan
The below shows the plan level activity for the current time period. The balances are based on all activity employed and terminated plan
participants. The balances do not include any unallocated assets or outstanding loan amounts.
Plan Activity April 01, 2022 through June 30, 2022
Investment Options Balances as of Percentage* Contribution Other Transfers Distributions Expenses** Investment Balances as of Percentage*
3/31/2022 s Activity Income 6/30/2022
Parnassus Core Equity Fund $9,335,412 1.39% $155,180 $12,258 $186,703 ($196,581) ($1,206) ($1,447,414) $8,044,352 1.34%
Vanguard Institutional Index Fund $35,052,953 5.24% $398,578 $26,831 $264,944 ($426,685) ($4,669) ($5,697,628) $29,614,324 4.94%
Vanguard Total Stock Mkt Index Fd $25,951,392 3.88% $457,709 $59,509 ($118,354) ($326,228) ($3,617) ($4,416,096) $21,604,315 3.60%
American Funds Grth Fund of America $49,596,777 7.41% $361,376 $40,164 ($1,660,969) ($281,889) ($6,235) ($10,633,996) $37,415,228 6.24%
American Century Mid Cap Value Fund $6,857,429 1.02% $62,547 $6,212 $641,090 ($73,994) ($950) ($730,731) $6,761,604 1.13%
Vanguard Mid Cap Index Fund $10,320,138 1.54% $142,028 $20,065 $3,650 ($94,043) ($1,364) ($1,767,103) $8,623,371 1.44%
MassMutual Mid Cap Growth Fund $18,129,866 2.71% $125,246 $10,155 ($920,607) ($189,856) ($2,205) ($3,111,286) $14,041,313 2.34%
Boston Partners Sm Cap Val II Fd $0 0.00% $15,658 $3,214 $1,079,670 ($24,037) ($121) ($72,786) $1,001,598 0.17%
Small Cap Value CIT $1,350,295 0.20% $8,929 $1,036 ($1,269,644) ($1,403) ($65) ($89,148) $0 0.00%
Vanguard Small Cap Index Fund $14,557,404 2.17% $190,656 $16,075 $66,382 ($121,192) ($1,871) ($2,468,907) $12,238,546 2.04%
Harbor Small Cap Growth Fund $0 0.00% $50,296 $6,063 $6,817,190 ($10,921) ($615) ($707,449) $6,154,564 1.03%
Small Cap Growth CIT $7,767,201 1.16% $34,770 $3,133 ($6,770,887) ($30,308) ($351) ($1,003,558) $0 0.00%
American Fnds Cap Wld Gr and Inc Fd $12,547,210 1.87% $128,143 $1,860 ($53,074) ($94,023) ($1,690) ($1,844,036) $10,684,389 1.78%
Vanguard Developed Markets Index Fd $4,472,318 0.67% $100,003 $16,930 $199,288 ($53,734) ($613) ($646,915) $4,087,277 0.68%
Amer Funds EuroPacific Growth Fund $10,009,404 1.49% $108,240 $13,848 $92,288 ($116,562) ($1,332) ($1,467,518) $8,638,368 1.44%
Invesco Developing Markets Fund $3,240,634 0.48% $68,573 $9,811 ($14,697) ($15,758) ($434) ($372,258) $2,915,870 0.49%
Invesco Real Estate Fund $3,988,982 0.60% $82,198 $21,099 ($26,085) ($88,827) ($545) ($518,971) $3,457,851 0.58%
Bank of The West Savings $6,813,480 1.02% $87,991 $4,002 $392,825 ($49,168) ($996) $8,435 $7,256,569 1.21%
Hartford Healthcare HLS Fund $7,458,245 1.11% $62,757 $4,045 ($587,865) ($68,869) ($947) ($664,203) $6,203,163 1.03%
*Due to rounding, percentages may not total 100 percent.
**The expenses shown reflect expenses deducted from plan assets. Does not include expenses billed directly to the plan sponsor or expenses related to the expense ratio of investments
under the plan.
FOR FINANCIAL PROFESSIONAL AND PLAN SPONSOR USE ONLY. RO1583135