
Page 163 - FebDefComp
P. 163
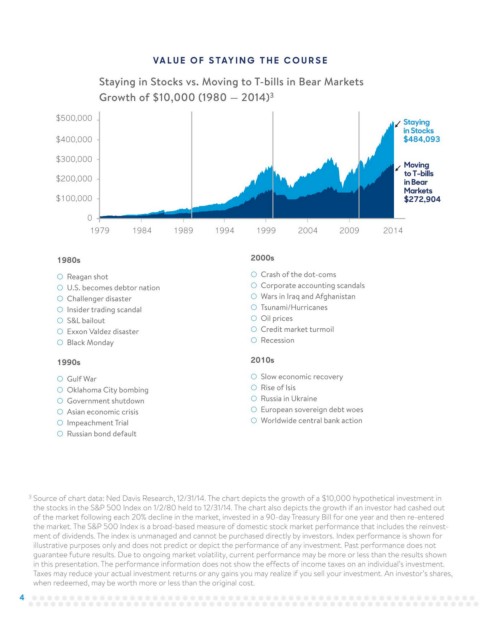
VA L UE OF S TAYING THE COURSE


                          Staying in Stocks vs. Moving to T-bills in Bear Markets
                                                                      3
                          Growth of $10,000 (1980 — 2014)
               $500,000
                                                                                                        Staying
                                                                                                        in Stocks
               $400,000                                                                                 $484,093

               $300,000
                                                                                                        Moving
                                                                                                        to T-bills
               $200,000                                                                                 in Bear
                                                                                                        Markets
               $100,000                                                                                 $272,904

                       0
                        1979       1984      1989       1994      1999       2004       2009       2014


               1980s                                             2000s

               ○ Reagan shot                                     ○ Crash of the dot-coms
               ○ U.S. becomes debtor nation                      ○ Corporate accounting scandals
               ○ Challenger disaster                             ○ Wars in Iraq and Afghanistan
               ○ Insider trading scandal                         ○ Tsunami/Hurricanes
               ○ S&L bailout                                     ○ Oil prices
               ○ Exxon Valdez disaster                           ○ Credit market turmoil
               ○ Black Monday                                    ○ Recession

               1990s                                             2010s

               ○ Gulf War                                        ○ Slow economic recovery
               ○ Oklahoma City bombing                           ○ Rise of Isis
               ○ Government shutdown                             ○ Russia in Ukraine
               ○ Asian economic crisis                           ○ European sovereign debt woes
               ○ Impeachment Trial                               ○ Worldwide central bank action
               ○ Russian bond default


        3  Source of chart data: Ned Davis Research, 12/31/14. The chart depicts the growth of a $10,000 hypothetical investment in
         the stocks in the S&P 500 Index on 1/2/80 held to 12/31/14. The chart also depicts the growth if an investor had cashed out
         of the market following each 20% decline in the market, invested in a 90-day Treasury Bill for one year and then re-entered
         the market. The S&P 500 Index is a broad-based measure of domestic stock market performance that includes the reinvest-
         ment of dividends. The index is unmanaged and cannot be purchased directly by investors. Index performance is shown for
         illustrative purposes only and does not predict or depict the performance of any investment. Past performance does not
         guarantee future results. Due to ongoing market volatility, current performance may be more or less than the results shown
         in this presentation. The performance information does not show the effects of income taxes on an individual’s investment.
         Taxes may reduce your actual investment returns or any gains you may realize if you sell your investment. An investor’s shares,
         when redeemed, may be worth more or less than the original cost.

      4