
Page 92 - FebDefComp
P. 92
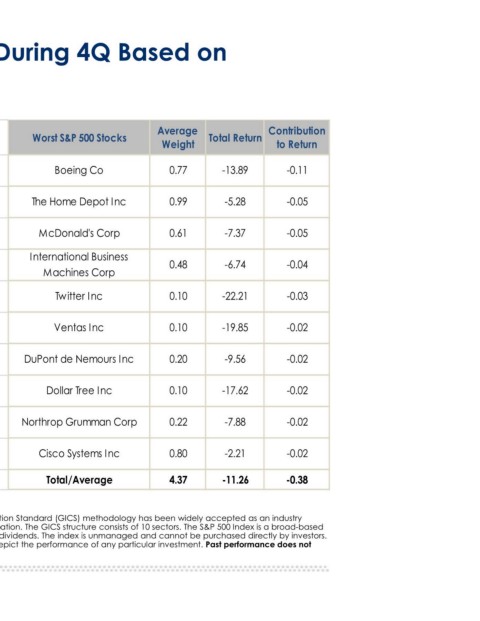
Contribution   to Return  -0.11  -0.05  -0.05  -0.04  -0.03  -0.02  -0.02  -0.02  -0.02  -0.02  -0.38


                                     Total Return  -13.89  -5.28  -7.37  -6.74  -22.21  -19.85  -9.56  -17.62  -7.88  -2.21  -11.26


                Best & Worst S&P 500 Stocks During 4Q Based on


                                   Average   Weight  0.77  0.99  0.61  0.48  0.10    0.10     0.20    0.10    0.22    0.80  4.37


                                     Worst S&P 500 Stocks  Boeing Co  The Home Depot Inc  McDonald's Corp  International Business   Machines Corp  Twitter Inc  Ventas Inc  DuPont de Nemours Inc  Dollar Tree Inc  Northrop Grumman Corp  Cisco Systems Inc  Total/Average


                                   Contribution   to Return  1.21  0.59  0.30  0.29  0.27  0.21  0.19  0.19   0.16    0.15  3.56      Source of chart data: Morningstar Direct, 12/31/2019. The Global Industry Classification Standard (GICS) methodology has been widely accepted as an industry  analysis framework for investment research, portfolio management and asset allocation. The GICS structure consists of 10 sectors. The S&P 500 Index is a broad-based  measure of domestic stock market performance that includes the reinvestment of dividends. The index is unmanaged and cannot be purchased directly by investors.  Index perform


                                     Total Return  31.50  13.82  35.80  19.40  15.26  21.40   6.45    13.53   16.78   35.27  20.92
                       Contribution to Return


                                   Average   Weight  4.14  4.36  0.93  1.58  1.81    1.03     2.91    1.39    0.97    0.47  19.59 The mention of specific companies does not constitute a recommendation.


                            as of 12/31/2019  Best S&P 500 Stocks  Apple Inc  Microsoft Corp  UnitedHealth Group Inc  JPMorgan Chase & Co  Facebook Inc A  Bank of America Corp  Amazon.com Inc  Johnson & Johnson  Intel Corp  NVIDIA Corp  Total/Average  guarantee future results.