
Page 98 - FebDefComp
P. 98
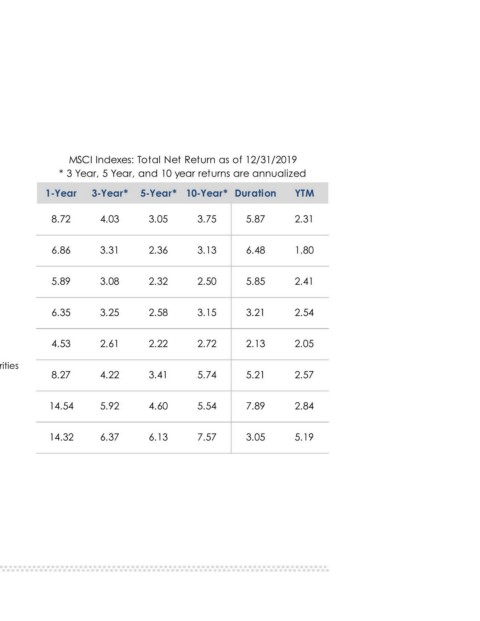
YTM    2.31    1.80    2.41    2.54    2.05   2.57    2.84    5.19
                                              * 3 Year, 5 Year, and 10 year returns are annualized
                                           MSCI Indexes: Total Net Return as of 12/31/2019

                                                   Duration  5.87  6.48   5.85    3.21    2.13   5.21    7.89    3.05


                                                   10-Year*  3.75  3.13   2.50    3.15    2.72   5.74    5.54    7.57


                                                   5-Year*  3.05  2.36    2.32    2.58    2.22   3.41    4.60    6.13


                                                   3-Year*  4.03  3.31    3.08    3.25    2.61   4.22    5.92    6.37


                                                   1-Year  8.72   6.86    5.89    6.35    4.53   8.27    14.54   14.32


                       Fixed Income Returns


                                             Income Returns  4Q 2019  U.S. Aggregate  U.S. Treasury  U.S. Agency  U.S. Mortgage Backed Securities  U.S. Asset Backed Securities U.S. Commercial Mortgage Backed Securities  U.S. Corp. Investment Grade  14.54  High Yield  14.32  QTD  YTD  Morningstar, 12/31/2019. Chart and Annual Returns Bloomberg,  12/31/2019. Duration and YTM Past performance does not guarantee future results.


                            as of 12/31/2019  Fixed      0.18  8.72  6.86  5.89  0.71  6.35  0.39  4.53  8.27  1.18  2.61               Source:


                                                                -0.79  -0.09                  -0.31