
Page 60 - FebDefComp
P. 60
Performance less than 1 year is not annualized
Average Annual Total Returns (%)
SIA = Separate Investment Account
CIT = Collective Investment Trust
STK = Company Stock Account
SV = Fixed Rate Stable Value
UI = Unitized Investment
MF = Mutual Fund
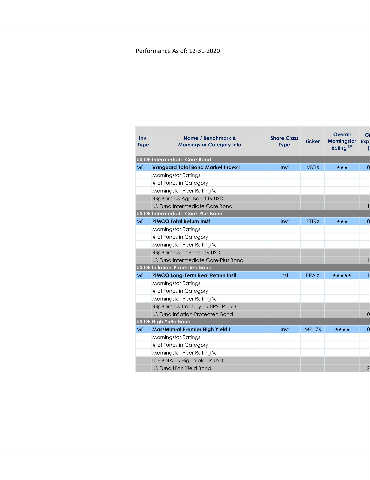
Overall Net Exp 10-Yr/ Gross 3-Yr Perf Incep Morningstar Since 5-Yr 3-Yr 1-Yr YTD 3-Mo Exp Ratio Ratio 1 Risk Date Incep* (%) (%) Rating TM ★★★ 3.50 09/18/1995 3.81 4.47 5.41 7.74 7.74 0.67 0.04 0.04 ★★★ ★★★ ★★★ 252 330 380 415 46 37 31 45 3.40 01/03/1980 3.84 4.44 5.34 7.51 7.51 0.67 3.29 11/1/1954 3.69 4.26 5.11 7.52 7.52 0.95 0.64 1.23 ★★★ 3.44 05/11/1987 4.19 4.86 5.54 8.88 8.88 1.06 0.70 0.70 ★★★ ★★★ ★★★ 343 464 543 602 55 50 43 34 3.45 12/31/1998 4.16 4.87 5.45 7.58 7.58 1.29 4.11 04/24/1928 4.25 4.86 5.34 8.06 8.06 1.97 0.78 1.00 10.48 11/12/2001 6.96 10.33 11.67 27.21 27.21 2.55 1.07 1.07 ★★★★★ ★★★★★ ★★★★★ ★★★★★ 117 173 197 207 2 1 1 1 3.87 04/15/1998 3.81 5.08 5
Ticker VBTIX PTTRX PRAIX MPHZX
Share Class Type Inst Inst Inst Inst
Name / Benchmark & Morningstar Category Info Vanguard Total Bond Market Index I US Fund Intermediate Core-Plus Bond PIMCO Long-Term Real Return Instl BBgBarc US Treasury US TIPS TR USD
Performance As of: 12‐31‐2020
US OE Intermediate Core Bond
Morningstar Ratings # of Funds in Category Morningstar Peer Rating % BBgBarc US Agg Bond TR USD US Fund Intermediate Core Bond US OE Intermediate Core-Plus Bond PIMCO Total Return Instl Morningstar Ratings # of Funds in Category Morningstar Peer Rating % BBgBarc US Universal TR USD US OE Inflation-Protected Bond Morningstar Ratings # of Funds in Category Morningstar Peer Rating % US Fund Inflation-Protected Bond US OE High Yield Bond MassMutual Premier High Yield I Morningstar Ratings # of Funds in Category Morningstar Peer Rating % ICE BofA US High Yield TR USD US Fund High Yield Bond
Inv. Type MF MF MF MF