
Page 15 - MayDefComp
P. 15
Quarterly Market Recap
as of 3/31/2019
Quarterly Data Center
Index Returns (%)
Equities Level QTD YTD 1 Year Global Market Data U.S. EU Japan China
S&P 500 2,834.40 13.65 13.65 9.50 GDP Growth (YOY) (%) 2.40 1.10 0.70 6.20
Russell 2000 1,539.74 14.58 14.58 2.05 CPI (YOY) (%) 1.90 1.30 0.80 2.00
MSCI EAFE 1,875.43 9.98 9.98 -3.71 Unemployment (%) 3.90 7.80 2.40 3.90
MSCI EM 1,058.13 9.91 9.91 -7.41 Central Bank Rate (Level) 2.50 0.00 0.00 4.25
NASDAQ 7,729.32 16.81 16.81 10.63 10 Year Govt. Yield (%) 2.41 -0.07 -0.08 3.07
*Forecasted Q1 2019
Fixed Income YTM QTD YTD 1 Year Chart of the Quarter
U.S. Aggregate 2.93 2.94 2.94 4.48
U.S. Corporates 3.63 5.14 5.14 4.94
Barclays U.S. High Yield 6.43 7.26 7.26 5.93
Citi WGBI Non-USD 1.32 1.52 1.52 -4.55
Other / Specialty Level QTD YTD 1 Year
Bloomberg Commodity Index 81.09 6.32 6.32 -5.25
FTSE NAREIT Equity REIT Index 690.89 16.33 16.33 20.86
Gold 1,292.38 0.77 0.77 -2.50
Brent Oil 68.39 27.12 27.12 -2.68
Source: Bloomberg, 03/31/2019
Morningstar Direct, 03/31/2019
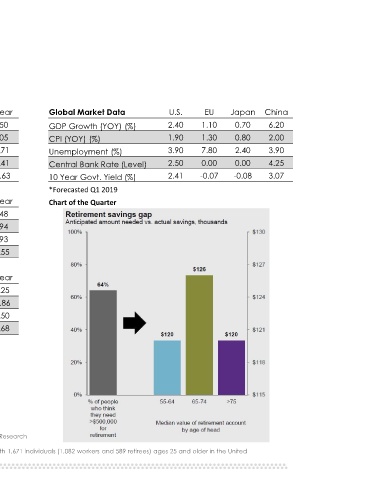
Source: J.P. Morgan Asset Management; 2017 Retirement Confidence Survey, Employee Benefit Research
Institute and Greenwald & Associates; 2016 Survey of Consumer Finances, Federal Reserve.
EBRI survey was conducted from January 6, 2017 to January 13, 2017 through online interviews with 1,671 individuals (1,082 workers and 589 retirees) ages 25 and older in the United
States. Guide to the Markets – U.S. Data are as of March 31, 2019.