
Page 27 - MayDefComp
P. 27
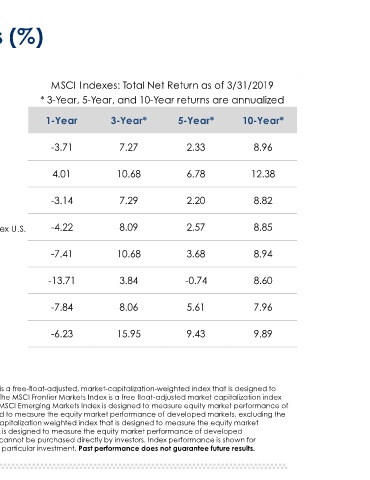
Global Equity Market Returns (%)


 as of 3/31/2019


                  MSCI Indexes: Total Net Return as of 3/31/2019


 MSCI Indexes  * 3-Year, 5-Year, and 10-Year returns are annualized


                1-Year                3-Year*               5-Year*              10-Year*
 1Q 2019


 9.98  MSCI EAFE Index  -3.71            7.27                  2.33                  8.96
 9.98


 12.48  MSCI World Index  4.01          10.68                  6.78                 12.38
 12.48


 10.45  MSCI World Index ex. U.S.  -3.14  7.29                 2.20                  8.82
 10.45


 12.18  MSCI All Country World Index ex U.S.  -4.22  8.09      2.57                  8.85
 10.31


 9.91  MSCI Emerging Markets Index  -7.41  10.68               3.68                  8.94
 9.91

 6.91  MSCI Germany  -13.71              3.84                 -0.74                  8.60
 6.91


 6.66  MSCI Japan  -7.84                 8.06                  5.61                  7.96
 6.66


 17.69  MSCI China  -6.23               15.95                  9.43                  9.89
 17.69


 QTD  YTD


 Source:  Morningstar Direct, 03/31/201. The MSCI All Country World Index (ACWI) is a free-float-adjusted, market-capitalization-weighted index that is designed to
 measure the equity market performance of developed and emerging markets. The MSCI Frontier Markets Index is a free float-adjusted market capitalization index
 that is designed to measure equity market performance of frontier markets. The MSCI Emerging Markets Index is designed to measure equity market performance of
 emerging markets. The MSCI EAFE Index (Europe, Australasia, Far East) is designed to measure the equity market performance of developed markets, excluding the
 U.S. and Canada. The MSCI World Index ex U.S.  is a free float-adjusted market capitalization weighted index that is designed to measure the equity market
 performance of developed markets and excludes the U.S. The MSCI World Index is designed to measure the equity market performance of developed
 markets. Each index is unmanaged, includes the reinvestment of dividends and cannot be purchased directly by investors. Index performance is shown for
 illustrative purposes only and does not predict or depict the performance of any particular investment. Past performance does not guarantee future results.