
Page 103 - MayDefComp
P. 103
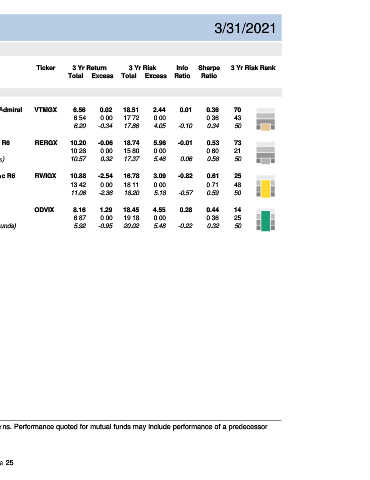
Risk Analysis                                                          3/31/2021


 Asset Class: International

             Ticker      3 Yr Return        3 Yr Risk      Info    Sharpe    3 Yr Risk Rank
                        Total  Excess    Total   Excess    Ratio   Ratio


 RISK / RETURN (3-Year)

 Vanguard Developed Markets Index Admiral  VTMGX  6.56  0.02  18.51  2.44  0.01  0.36  70
 11.0
 MSCI EAFE               6.54     0.00    17.72    0.00              0.36     43
 Foreign Large Blend Median (234 funds)  RERGX  10.20  -0.34  17.86  4.05  -0.10  0.34  50  3 Yr
                         6.20
 Return (Total Annualized Return, %)  5.5  MSCI EAFE Growth  RWIGX  10.26  -2.54  15.80  0.00  -0.57  0.60  21  3 Yr
 8.3
                                                    5.96
                                 -0.06
                                          18.74
 American Funds Europacific Growth R6
                                                            -0.01
                                                                     0.53
                                                                              73
                                  0.00
 Foreign Large Growth Median (116 funds)
                                                                     0.58
                                          17.37
                        10.57
                                                                              50
                                  0.32
                                                            0.06
                                                    5.46
                                          16.78
                                                            -0.82
                        10.88
                                                                              25
                                                    3.09
                                                                     0.61
 American Funds Capital World Gr&Inc R6
                                                                     0.71
                                                                              48
                                          18.11
                                                   0.00
                                  0.00
                        13.42
 MSCI World
                                          18.20
 World Large Stock Median (244 funds)
                                                                              50
                                                    5.18
                                                                     0.59
                        11.06
                                 -2.36
 2.8
 Invesco Developing Markets R6
                         8.16
                                                                     0.44
                                                    4.55
                                  1.29
                                          19.18
 MSCI Emerging Markets  ODVIX  6.87  0.00  18.45   0.00     0.28     0.36     14       3 Yr
                                                                              25
 0.0
 Diversified Emerging Mkts Median (251 funds)  5.92  -0.95  20.02  5.48  -0.22  0.32  50
 0.0  5.0  10.0  15.0  20.0
                                                                                       3 Yr
 Risk (Total Annualized StdDev, %)
 RISK / RETURN PEER RANK (3-Year)
 1
 Return Rank (Total Return Rank, %)  50
 25
 75
 100
 0.0  5.0  10.0  15.0  20.0
 Risk (Total Annualized StdDev, %)
 Past performance is no guarantee of future results. Rankings provided based on total returns. Performance quoted for mutual funds may include performance of a predecessor
 fund/share class prior to the share class commencement of operations.


 Page 25