
Page 157 - NovDefComp
P. 157
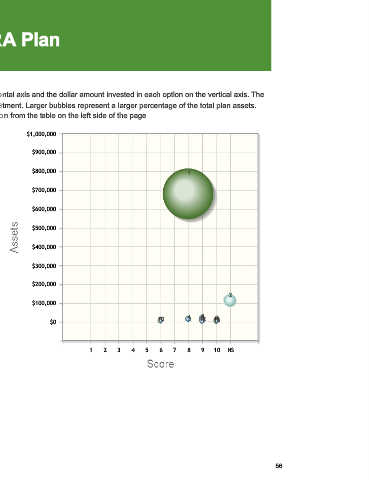
Scorecard Scatter Chart - HRA Plan


 This scatter chart shows each investment option with the fund score on the horizontal axis and the dollar amount invested in each option on the vertical axis. The
 size of the bubble correlates to the percentage of the overall assets in each investment. Larger bubbles represent a larger percentage of the total plan assets.
 The numbered data labels represent the ID associated with each investment option from the table on the left side of the page


          $1,000,000
 Chart ID  Investment Name

 1  Vanguard Target Retirement Series Inv  $900,000

 2  MassMutual Stable Value Group
           $800,000                                            1
 3  Vanguard Mid Cap Index Admiral
 4  American Funds Fundamental Invs F3  $700,000

 5  Parnassus Core Equity Investor
           $600,000
 6  Vanguard Developed Markets Index Admiral
 7  PIMCO Total Return A
           $500,000
 8  PIMCO Real Return A
 9  Vanguard Total Stock Mkt Idx Adm  $400,000

 10  American Funds Growth Fund of Amer F3
           $300,000
 11  Vanguard Total Bond Market Index Adm

 12  Vanguard Small Cap Index Adm  $200,000
 13  AB Small Cap Growth Advisor                                            2
           $100,000

                                                               4   3 5 6
                                                                        7
                                                      8 10         12  13
                                                                        9 11
                 $0

                              1    2    3   4    5    6   7    8   9   10   NS


                                                                                            56