
Page 32 - DeferredComp-May2018
P. 32
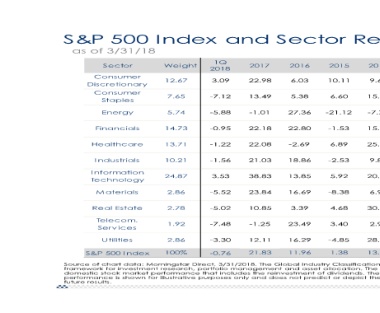
S&P 500 Index and Sector Re

   as of 3/31/18

         Sector  Weight    1Q   2017   2016   2015    201
                 12.67   2018   22.98  6.03   10.11    9.6
    Consumer      7.65    3.09  13.49  5.38           15.9
Discretionary                                  6.60
                         -7.12
    Consumer
        Staples

Energy           5.74    -5.88  -1.01  27.36  -21.12  -7.7

Financials       14.73   -0.95  22.18  22.80  -1.53   15.2

Healthcare       13.71   -1.22  22.08  -2.69  6.89    25.3

  I ndustrials   10.21   -1.56  21.03  18.86  -2.53    9.8
                 24.87    3.53  38.83  13.85   5.92   20.1
I nformation      2.86   -5.52  23.84  16.69  -8.38
Technology                                             6.9

   M aterials

Real Estate      2.78    -5.02  10.85  3.39   4.68    30.1

Telecom.         1.92    -7.48  -1.25  23.49  3.40    2.9
Serv ices

U tilities       2.86    -3.30  12.11  16.29  -4.85   28.9

S&P 500 I ndex   100%    -0.76  21.83  11.96  1.38    13.6

Source of chart data: Morningstar Direct, 3/31/2018. The Global Industry Classification
framework for investment research, portfolio management and asset allocation. The
domestic stock market performance that includes the reinvestment of dividends. The
performance is shown for illustrative purposes only and does not predict or depict the
future results.