
Page 33 - DeferredComp-May2018
P. 33
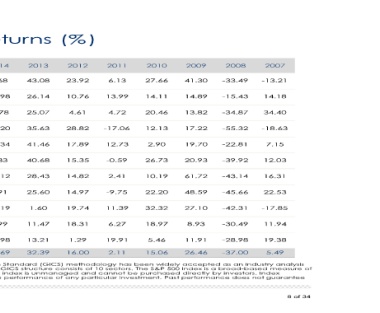
eturns (%)

14   2013   2012   2011    2010   2009    2008    2007
68   43.08  23.92  6.13    27.66  41.30  -33.49  -13.21

.98  26.14  10.76  13.99   14.11  14.89  -15.43  14.18

78   25.07  4.61   4.72    20.46  13.82  -34.87  34.40

.20  35.63  28.82  -17.06  12.13  17.22  -55.32  -18.63

.34  41.46  17.89  12.73   2.90   19.70  -22.81  7.15

83   40.68  15.35  -0.59   26.73  20.93  -39.92  12.03

.12  28.43  14.82  2.41    10.19  61.72  -43.14  16.31

91   25.60  14.97  -9.75   22.20  48.59  -45.66  22.53

.19  1.60   19.74  11.39   32.32  27.10  -42.31  -17.85

99   11.47  18.31  6.27    18.97  8.93   -30.49  11.94

.98  13.21  1.29   19.91   5.46   11.91  -28.98  19.38

.69  32.39  16.00  2.11    15.06  26.46  -37.00  5.49

n Standard (GICS) methodology has been widely accepted as an industry analysis
   GICS structure consists of 10 sectors. The S&P 500 Index is a broad-based measure of
    index is unmanaged and cannot be purchased directly by investors. Index

e performance of any particular investment. Past performance does not guarantee

                                                        8 of 34