
Page 320 - DCAC February 2024 Files
P. 320
1 Inception Since 10 7 5 3 Date Inception Years Years Years Years Year 09/01/2021 (25) 5.19 (28) 9.47 (33) 10.09 (65) 11.08 (50) 9.64 (64) 9.75 (74) 3.03 (63) 8.40 (78) 8.32 (70) 10.91 (66) 8.86 (57) 11.46 (2) 8.65 (16) 10.01 (24) 10.66 (13) 14.11 (6) 13.10 (10) 22.23 4.26 8.70 9.33 11.83 9.59 12.63 09/01/2021 (25) 3.99 (49) 11.00 (66) 12.06 (73) 13.87
(64) (57) (10) (38) (37) (37) (37) (71) (90) (37) (94) (40) (25) (25) (64) (80) (49) (69)
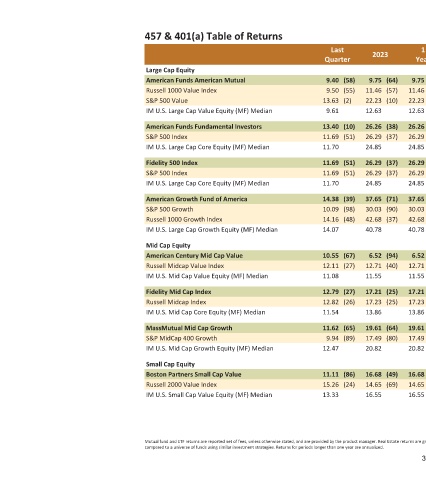
2023 9.75 11.46 22.23 12.63 26.26 26.29 24.85 26.29 26.29 24.85 37.65 30.03 42.68 40.78 6.52 12.71 11.55 17.21 17.23 13.86 19.61 17.49 20.82 16.68 14.65 16.55 Mutual fund and ETF returns are reported net of fees, unless otherwise stated, and are provided by the product manager. Real Estate returns are gross of fees. Numbers in parentheses represent the percentile rank of a return as
Last Quarter (58) 9.40 (55) 9.50 (2) 13.63 9.61 (10) 13.40 (51) 11.69 11.70 (51) 11.69 (51) 11.69 11.70 (39) 14.38 (98) 10.09 (48) 14.16 14.07 (67) 10.55 (27) 12.11 11.08 (27) 12.79 (26) 12.82 11.54 (65) 11.62 (89) 9.94 12.47 (86) 11.11 (24) 15.26 13.33
457 & 401(a) Table of Returns Large Cap Equity American Funds American Mutual Russell 1000 Value Index S&P 500 Value IM U.S. Large Cap Value Equity (MF) Median American Funds Fundamental Investors S&P 500 Index IM U.S. Large Cap Core Equity (MF) Median Fidelity 500 Index S&P 500 Index IM U.S. Large Cap Core Equity (MF) Median American Growth Fund of America S&P 500 Growth Russell 1000 Growth Index IM U.S. Large