
Page 325 - DCAC February 2024 Files
P. 325
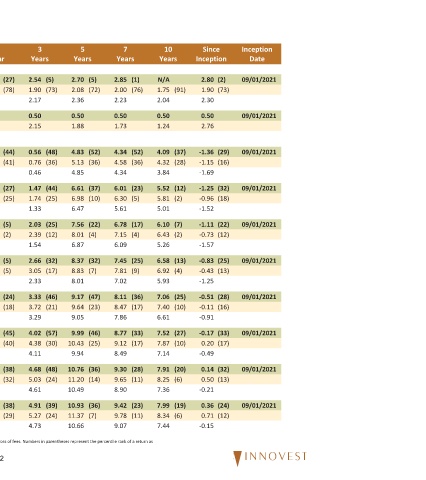
Inception  Date  09/01/2021  09/01/2021  09/01/2021  09/01/2021  09/01/2021  09/01/2021  09/01/2021  09/01/2021  09/01/2021  09/01/2021


             Since  Inception  (2)  2.80  (73)  1.90  2.30  0.50  2.76  (29)  -1.36  (16)  -1.15  -1.69  (32)  -1.25  (18)  -0.96  -1.52  (22)  -1.11  (12)  -0.73  -1.57  (25)  -0.83  (13)  -0.43  -1.25  (28)  -0.51  (16)  -0.11  -0.91  (33)  -0.17  (17)  0.20  -0.49  (32)  0.14  (13)  0.50  -0.21  (24)  0.36  (12)  0.71  -0.15


                      (91)          (37)  (28)  (12)  (2)  (7)  (2)  (13)  (4)  (25)  (10)  (27)  (10)  (20)  (6)  (19)  (6)
             10  Years  N/A  1.75  2.04  0.50  1.24  4.09  4.32  3.84  5.52  5.81  5.01  6.10  6.43  5.26  6.58  6.92  5.93  7.06  7.40  6.61  7.52  7.87  7.14  7.91  8.25  7.36  7.99  8.34  7.44


                   (1)  (76)        (52)  (36)  (23)  (5)  (17)  (4)  (25)  (9)  (36)  (17)  (33)  (17)  (28)  (11)  (23)  (11)
               Years  2.85  2.00  2.23  0.50  1.73  4.34  4.58  4.34  6.01  6.30  5.61  6.78  7.15  6.09  7.45  7.81  7.02  8.11  8.47  7.86  8.77  9.12  8.49  9.30  9.65  8.90  9.42  9.78  9.07
             7


                   (5)  (72)        (52)  (36)  (37)  (10)  (22)  (4)  (32)  (7)  (47)  (23)  (46)  (25)  (36)  (14)  (36)  (7)
             5  Years  2.70  2.08  2.36  0.50  1.88  4.83  5.13  4.85  6.61  6.98  6.47  7.56  8.01  6.87  8.37  8.83  8.01  9.17  9.64  9.05  9.99  10.43  9.94  10.76  11.20  10.49  10.93  11.37  10.66


                   (5)  (73)        (48)  (36)  (44)  (25)  (25)  (12)  (32)  (17)  (46)  (21)  (57)  (30)  (48)  (24)  (39)  (24)
             3  Years  2.54  1.90  2.17  0.50  2.15  0.56  0.76  0.46  1.47  1.74  1.33  2.03  2.39  1.54  2.66  3.05  2.33  3.33  3.72  3.29  4.02  4.38  4.11  4.68  5.03  4.61  4.91  5.27  4.73


                   (27)  (78)       (44)  (41)  (27)  (25)  (5)  (2)  (5)  (5)  (24)  (18)  (45)  (40)  (38)  (32)  (38)  (29)
             1  Year  3.06  2.47  2.82  0.50  5.02  10.74  10.80  10.63  12.51  12.65  11.64  14.55  14.74  12.49  16.03  16.26  14.36  17.14  17.43  16.30  18.34  18.60  18.11  19.48  19.77  19.20  20.17  20.48  19.84  32


                   (27)  (78)       (44)  (41)  (27)  (25)  (5)  (2)  (5)  (5)  (24)  (18)  (45)  (40)  (38)  (32)  (38)  (29)
              2023  3.06  2.47  2.82  0.50  5.02  10.74  10.80  10.63  12.51  12.65  11.64  14.55  14.74  12.49  16.03  16.26  14.36  17.14  17.43  16.30  18.34  18.60  18.11  19.48  19.77  19.20  20.17  20.48  19.84 Mutual fund and ETF returns are reported net of fees, unless otherwise stated, and are provided by the product manager. Real Estate returns are gross of fees. Numbers in parentheses represent the percentile rank of


             Last  Quarter  (23)  0.89  (29)  0.75  0.74  0.12  1.37  (56)  7.34  (56)  7.33  7.58  (66)  8.00  (68)  7.97  8.18  (29)  8.87  (31)  8.85  8.60  (36)  9.53  (38)  9.51  9.33  (62)  9.82  (62)  9.86  9.96  (73)  10.23  (75)  10.20  10.54  (67)  10.57  (70)  10.54  10.85  (63)  10.79  (64)  10.78  11.04


          457 & 401(a) Table of Returns  Stable Value  SAGIC Core Bond  Ryan 3 Yr GIC Master Index IM U.S. GIC/Stable Value (SA+CF) Median  Bank of the West Savings  90 Day U.S. Treasury Bill  Target Date Funds Vanguard Target Retirement Income Vanguard Target Income Composite Index IM Mixed-Asset Target Today (MF) Median  Vanguard Target Retirement 2020 Vanguard Target 2020 Composite Index IM Mixed-Asset Target 2020 (MF) Median