
Page 326 - DCAC February 2024 Files
P. 326
1 Inception Since 10 7 5 3 Date Inception Years Years Years Years Year 09/01/2021 (24) 0.36 (23) 7.97 (28) 9.41 (39) 10.92 (39) 4.92 (44) 20.16 (13) 0.71 (9) 8.34 (15) 9.78 (10) 11.37 (27) 5.27 (36) 20.48 -0.15 7.56 9.08 10.70 4.76 19.95 09/01/2021 (26) 0.38 (1) 7.97 (32) 9.41 (43) 10.92 (42) 4.92 (45) 20.18 (15) 0.71 (1) 8.34 (16) 9.78 (15) 11.37 (31)
(44) (36) (45) (37) (52) (42)
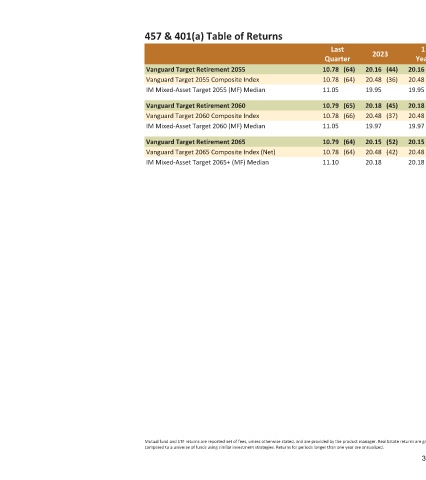
2023 20.16 20.48 19.95 20.18 20.48 19.97 20.15 20.48 20.18 Mutual fund and ETF returns are reported net of fees, unless otherwise stated, and are provided by the product manager. Real Estate returns are gross of fees. Numbers in parentheses represent the percentile rank of a return as
Last Quarter (64) 10.78 (64) 10.78 11.05 (65) 10.79 (66) 10.78 11.05 (64) 10.79 (64) 10.78 11.10
457 & 401(a) Table of Returns Vanguard Target Retirement 2055 Vanguard Target 2055 Composite Index IM Mixed-Asset Target 2055 (MF) Median Vanguard Target Retirement 2060 Vanguard Target 2060 Composite Index IM Mixed-Asset Target 2060 (MF) Median Vanguard Target Retirement 2065 Vanguard Target 2065 Composite Index (Net) IM Mixed-Asset Target 2065+ (MF) Median compared to a universe of funds using similar investment