
Page 339 - DCAC February 2024 Files
P. 339
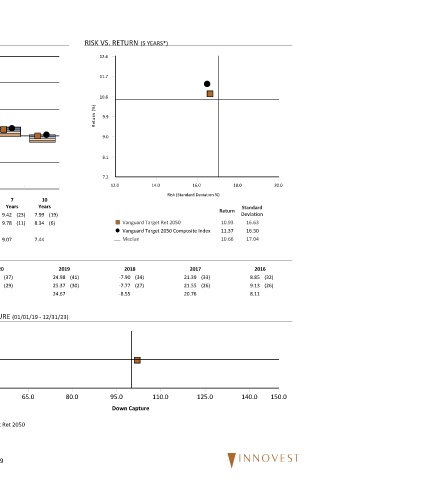
Vanguard Target Ret 2050 12/31/23
PEER GROUP ANALYSIS - IM Mixed-Asset Target 2050 (MF) RISK VS. RETURN (5 YEARS*)
26.0 12.6
11.7
20.0
10.8
14.0 Return (%)
Return 9.9
8.0 9.0
8.1
2.0
7.2
12.0 14.0 16.0 18.0 20.0
-4.0
Risk (Standard Deviation %)
Last Year 1 3 5 7 10
Quarter To Date Year Years Years Years Years Standard
Return
¢ £ Vanguard Target Ret 2050 10.79 (63) 20.17 (38) 20.17 (38) 4.91 (39) 10.93 (36) 9.42 (23) 7.99 (19) Deviation
Vanguard Target 2050 Composite Index 10.78 (64) 20.48 (29) 20.48 (29) 5.27 (24) 11.37 (7) 9.78 (11) 8.34 (6) ¢ £ Vanguard Target Ret 2050 10.93 16.63
Vanguard Target 2050 Composite Index 11.37 16.50
Median 11.04 19.84 19.84 4.73 10.66 9.07 7.44 ¾ Median 10.66 17.04
CALENDAR YEAR RETURNS AND PERCENTILE RANKINGS
2022 2021 2020 2019 2018 2017 2016
Vanguard Target Ret 2050 -17.46 (30) 16.41 (70) 16.39 (37) 24.98 (41) -7.90 (34) 21.39 (33) 8.85 (32)
Vanguard Target 2050 Composite Index -17.07 (20) 16.75 (59) 17.17 (29) 25.37 (30) -7.77 (27) 21.55 (26) 9.13 (26)
IM Mixed-Asset Target 2050 (MF) Median -18.30 17.00 15.52 24.67 -8.55 20.76 8.11
ASSET ALLOCATION UP/DOWN CAPTURE (01/01/19 - 12/31/23)
150.0
Equities 87.6% 125.0
Up Capture 100.0
Fixed Income 9.7%
Other
2.6% 75.0
Cash 0.1% 50.0
50.0 65.0 80.0 95.0 110.0 125.0 140.0 150.0
Convertibles 0.0%
Down Capture
0.0% 50.0% 100.0% 150.0%
Vanguard Target Ret 2050
*If less than 5 years, data is since inception of fund share class.
39