
Page 340 - DCAC February 2024 Files
P. 340
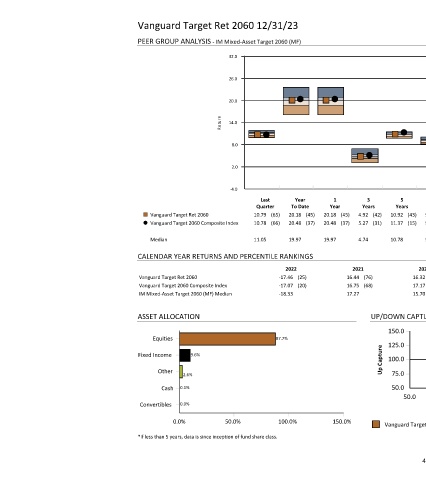
Vanguard Target Ret 2060 12/31/23
PEER GROUP ANALYSIS - IM Mixed-Asset Target 2060 (MF) RISK VS. RETURN (5 YEARS*)
32.0 12.8
26.0 12.0
11.2
20.0
Return 14.0 Return (%) 10.4
9.6
8.0
8.8
2.0
8.0
14.0 15.0 16.0 17.0 18.0 19.0 20.0
-4.0
Risk (Standard Deviation %)
Last Year 1 3 5 7 10
Quarter To Date Year Years Years Years Years Standard
Return
¢ £ Vanguard Target Ret 2060 10.79 (65) 20.18 (45) 20.18 (45) 4.92 (42) 10.92 (43) 9.41 (32) 7.97 (N/A) Deviation
Vanguard Target 2060 Composite Index 10.78 (66) 20.48 (37) 20.48 (37) 5.27 (31) 11.37 (15) 9.78 (16) 8.34 (N/A) ¢ £ Vanguard Target Ret 2060 10.92 16.61
Vanguard Target 2060 Composite Index 11.37 16.50
Median 11.05 19.97 19.97 4.74 10.78 9.14 N/A ¾ Median 10.78 17.13
CALENDAR YEAR RETURNS AND PERCENTILE RANKINGS
2022 2021 2020 2019 2018 2017 2016
Vanguard Target Ret 2060 -17.46 (25) 16.44 (76) 16.32 (41) 24.96 (57) -7.87 (33) 21.36 (46) 8.84 (25)
Vanguard Target 2060 Composite Index -17.07 (20) 16.75 (68) 17.17 (34) 25.37 (41) -7.77 (29) 21.55 (37) 9.13 (20)
IM Mixed-Asset Target 2060 (MF) Median -18.33 17.27 15.70 25.06 -8.49 21.27 7.86
ASSET ALLOCATION UP/DOWN CAPTURE (01/01/19 - 12/31/23)
150.0
Equities 87.7% 125.0
Up Capture 100.0
Fixed Income 9.6%
Other
2.6% 75.0
Cash 0.1% 50.0
50.0 65.0 80.0 95.0 110.0 125.0 140.0 150.0
Convertibles 0.0%
Down Capture
0.0% 50.0% 100.0% 150.0%
Vanguard Target Ret 2060
*If less than 5 years, data is since inception of fund share class.
40