Page 367 - DCAC February 2024 Files
P. 367

0.1                         150.0
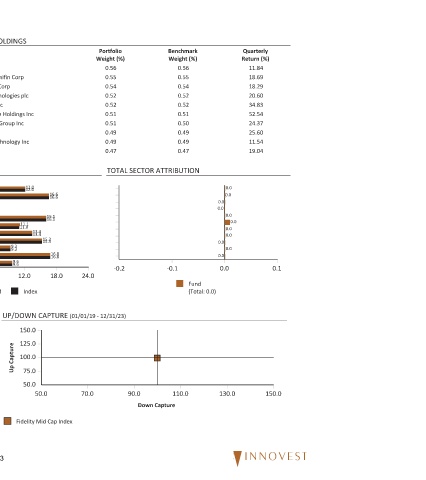
             Quarterly  Return (%)  11.84  18.69  18.29  20.60  34.83  52.54  24.37  25.60  11.54  19.04


                                                   0.0
                                            0.0  0.0  0.0  0.0  0.0  0.0                  130.0
                                               0.0  0.0  0.0  0.0  0.0
                                                                   (Total: 0.0) Fund
             Benchmark  Weight (%)  0.56  0.55  0.54  0.52  0.52  0.51  0.50  0.49  0.49  0.47  TOTAL SECTOR ATTRIBUTION  -0.1  110.0  Down Capture


             Portfolio  Weight (%)  0.56  0.55  0.54  0.52  0.52  0.51  0.51  0.49  0.49  0.47  -0.2  90.0


                                                                24.0     (01/01/19 - 12/31/23)  70.0


                                             16.6  16.6  16.1  16.1  15.3  15.3  16.8  16.8  18.0
                                                     13.4 11.1  11.0  13.4  12.0  Index  UP/DOWN CAPTURE  150.0  125.0  100.0  75.0  50.0  50.0  Fidelity Mid Cap Index
                                           12.0
                                            12.0
           TOP 10 HOLDINGS  Phillips 66  Parker-Hannifin Corp  Amphenol Corp  Trane Technologies plc  KKR & Co Inc  CrowdStrike Holdings Inc  TransDigm Group Inc  Cintas Corp  Marvell Technology Inc  PACCAR Inc  5.3  5.3  9.3  9.3  9.6  9.6  6.0  0.0  Fund  Up  Capture  53


             Benchmark  $24,355  $10,199  18.96  3.02  12.26  1.65  1.00  4.36  N/A  814  SECTOR PERFORMANCE  -0.5  -0.5  -6.0  Large Cap Growth  Small Cap Growth  Average Style Exposure


                                                               24.0

                                                     19.1  19.1
                                                               18.0  12.0  Index            Manager Style
                                                   15.3
                                                  15.3
             Portfolio
                 $10,195
               $24,367
                                  814
                                0.10
                         1.64
                       12.26
                              4.36
                           1.00
                     3.02
                   18.95
                                                        13.2
                                                       13.2
       Fidelity Mid Cap Index 12/31/23  PORTFOLIO CHARACTERISTICS  Wtd. Avg. Mkt. Cap $M  Median Mkt. Cap $M  Price/Earnings ratio  Price/Book ratio  5 Yr. EPS Growth Rate (%)  Current Yield (%)  Beta (5 Years, Monthly)  % in Int'l Securities  Active Share  Number of Stocks  SECTOR ALLOCATION  3.6 Communication Services  3.6 Consumer Discretionary  3.6 Consumer Staples  3.6  5.4  Energy  5.4  Financials  Health Care  Industrials
                                                    10.4
                                                    10.5
                                              10.2
                                             10.2
                                                          7.7
                                                           7.7
   362   363   364   365   366   367   368   369   370   371   372