
Page 364 - DCAC February 2024 Files
P. 364
28.0
24.0
Risk (Standard Deviation %)
20.0
(5 YEARS*)
16.0
12.0
RISK VS. RETURN
8.0
4.0
14.0
16.0
12.0
10.0
6.0
8.0
Return (%)
Years
10
Years
7
Years
5
Years
3
(25) Standard Return Deviation (11) 9.41 (16) 10.07 (28) 12.68 (79) 5.92 21.31 12.68 Fidelity Mid Cap Index (11) 9.42 (15) 10.07 (28) 12.68 (79) 5.92 (25) 21.32 12.68 Russell Midcap Index 20.67 11.70 Median 7.56 8.36 11.70 7.63 2016 2017 2018 2019 2020 2021 (55) 13.86 (26) 18.47 (20) -9.05 (32) 30.51 (17) 17.11 (69)
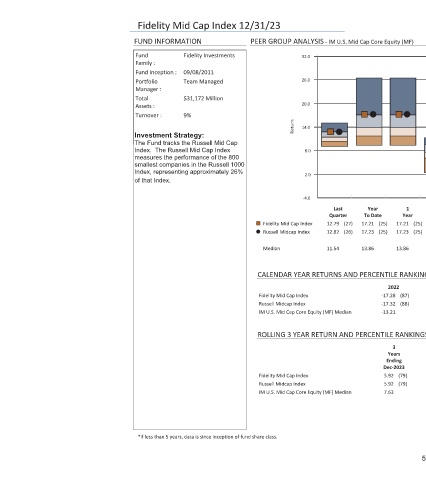
PEER GROUP ANALYSIS - IM U.S. Mid Cap Core Equity (MF)
1 Year 17.21 17.23 13.86 (87) (88) (79) (79)
2022 3 Years Ending Dec-2023
(25) (25) -17.28 -17.32 -13.21 5.92 5.92 7.63
Year To Date 17.21 17.23 13.86
(27) (26) CALENDAR YEAR RETURNS AND PERCENTILE RANKINGS
Last Quarter 12.79 12.82 11.54 ROLLING 3 YEAR RETURN AND PERCENTILE RANKINGS
32.0 26.0 20.0 14.0 Return 8.0 2.0 -4.0 Fidelity Mid Cap Index Russell Midcap Index Median Fidelity Mid Cap Index Russell Midcap Index IM U.S. Mid Cap Core Equity (MF) Median Fidelity Mid Cap Index Russell Midcap Index IM U.S. Mid Cap Core Equity (MF) Median
Fidelity Mid Cap Index 12/31/23 FUND INFORMATION Fidelity Investments Fund Family : 09/08/2011 Fund Inception : Team Managed Portfolio Manager : $31,172 Million Total Assets : 9% Turnover : Investment Strategy: The Fund tracks the Russell Mid Cap Index. The Russell Mid Cap Index measures the performance of the 800 smallest companies in the Russell 1000 Index, representing approximately 26% of that Index. *I