
Page 385 - DCAC February 2024 Files
P. 385
30.0 (45) (51) (44) (53)
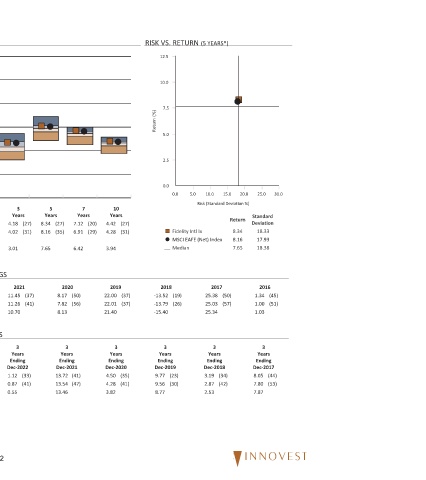
Standard Deviation 18.33 17.93 18.38 2016 3 Years Ending Dec-2017
25.0 1.34 1.00 1.03 8.05 7.80 7.87
20.0 Return 8.34 8.16 7.65
(5 YEARS*) 15.0 10.0 Risk (Standard Deviation %) MSCI EAFE (Net) Index 2017 (50) 25.38 (57) 25.03 25.34 3 Years Ending Dec-2018 (34) 3.19 (42) 2.87 2.53
RISK VS. RETURN 12.5 10.0 7.5 Return (%) 5.0 2.5 0.0 5.0 0.0 Fidelity Intl Ix Median 2018 (19) -13.52 (26) -13.79 -15.40 3 Years Ending Dec-2019 (23) 9.77 (30) 9.56 8.77
(27) (31) (37) (37) (35) (41)
10 Years 4.42 4.28 3.94 2019 22.00 22.01 21.40 3 Years Ending Dec-2020 4.50 4.28 3.82
(20) (29)
7 Years 7.12 6.91 6.42 (50) (56) (41) (47)
2020 3 Years Ending Dec-2021
(27) (35) 8.17 7.82 8.13 13.72 13.54 13.46
Years
5 8.34 8.16 7.65
(27) (31) (37) (41) (33) (41)
Years 2021
3 4.18 4.02 3.01 11.45 11.26 10.70 3 Years Ending Dec-2022 1.12 0.87 0.55
62
(30) (32)
PEER GROUP ANALYSIS - IM International Core Equity (MF)
1 Year 18.31 18.24 17.15 (31) (38) (27) (31)
2022 3 Years Ending Dec-2023
(30) (32) -14.24 -14.45 -15.18 4.18 4.02 3.01
Year To Date 18.31 18.24 17.15
(31) (43) CALENDAR YEAR RETURNS AND PERCENTILE RANKINGS
Last Quarter 10.75 10.42 10.19 ROLLING 3 YEAR RETURN AND PERCENTILE RANKINGS
26.0 20.0 14.0 8.0 Return 2.0 -4.0 -10.0 IM International Core Equity (MF) Median IM International Core Equity (MF) Median
Fidelity Intl Ix MSCI EAFE (Net) Index Median Fidelity Intl Ix MSCI EAFE (Net) Index Fidelity Intl Ix MSCI EAFE (Net) Index
Fidelity Intl Ix 12/31/23 FUND INFORMATION Fidelity Investments Fund Family : 09/08/2011 Fund Inception : Team Managed Portfolio Manager : $46,874 Million Total Assets : 4% Turnover : Investment Strategy: Fidelity® International Index Fund is a diversified international equity strategy that seeks to closely track the returns and characteristics of the MSCI EAFE Index, a market-cap-weighted index that includes