
Page 387 - DCAC February 2024 Files
P. 387
30.0% 150.0
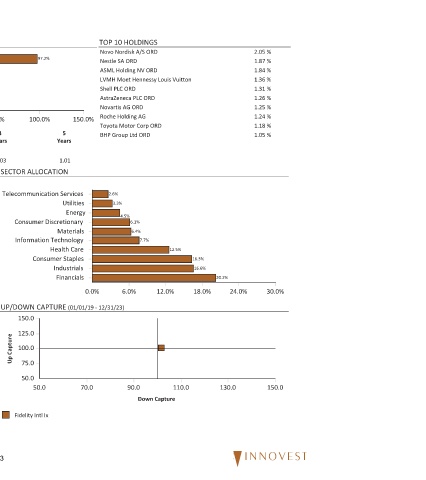
2.05 % 1.87 % 1.84 % 1.36 % 1.31 % 1.26 % 1.25 % 1.24 % 1.18 % 1.05 %
24.0%
20.2% 130.0
16.3% 16.6% 18.0% 12.0% 110.0
12.5%
TOP 10 HOLDINGS Novo Nordisk A/S ORD Nestle SA ORD ASML Holding NV ORD LVMH Moet Hennessy Louis Vuitton Shell PLC ORD AstraZeneca PLC ORD Novartis AG ORD Roche Holding AG Toyota Motor Corp ORD BHP Group Ltd ORD 2.6% 3.3% 4.5% 6.1% 6.4% 7.7% 6.0% 90.0 Down Capture
150.0% Energy 0.0% (01/01/19 - 12/31/23) 70.0
Years 1.01 Utilities Materials Health Care Industrials Financials
5 Consumer Staples
97.2% 100.0% SECTOR ALLOCATION Telecommunication Services Consumer Discretionary Information Technology UP/DOWN CAPTURE 150.0 125.0 100.0 75.0 50.0 50.0 Fidelity Intl Ix
50.0% 3 Years 1.03 Up Capture 63
100.0%
ASSET ALLOCATION Equities 1.5% Cash Other 1.0% 0.3% Fixed Income 0.0% Convertibles 0.0% vs. MSCI EAFE (Net) Index Beta 64.2% 80.0% 60.0% MSCI EAFE Growth Index MSCI Emerging Markets Index Average Style Exposure
40.0%
32.9%
21.91 % 13.46 % 10.86 % 10.32 % 8.34 % Manager Style
20.0% 0.0% Dec-2023
3.8%
Fidelity Intl Ix 12/31/23 PORTFOLIO CHARACTERISTICS 792 Total Securities $87,378 Million Avg. Market Cap 21.66 P/E 4.31 P/B 3.19% Div. Yield TOP 5 COUNTRIES Japan United Kingdom France Switzerland Germany REGION ALLOCATION Europe Pacific Basin Other Emg. MidEast, Africa, Europe North America Emerging Asia (10/01/11 - 12/31/23) STYLE MAP MSCI EAFE Value Index Capitalization MSCI EAFE Small Cap Sty
0.7%
0.3%
0.0%