
Page 393 - DCAC February 2024 Files
P. 393
30.0 (56) (29)
Standard Deviation 19.74 19.00 19.85 2016 3 Years Ending Dec-2017 (66) (40)
24.0 6.89 11.19 8.25 7.38 9.10 8.59
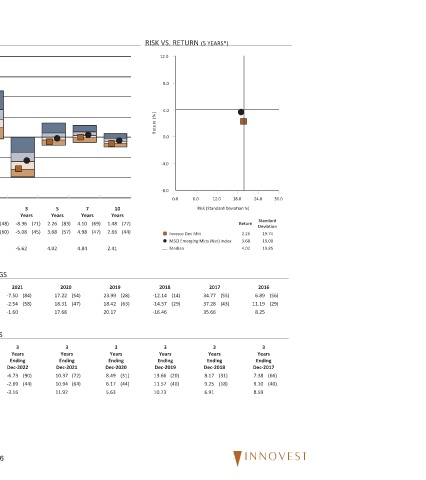
18.0 Return 2.26 3.68 4.02
(5 YEARS*) 12.0 6.0 Risk (Standard Deviation %) MSCI Emerging Mkts (Net) Index 2017 (55) 34.77 (43) 37.28 35.66 3 Years Ending Dec-2018 (31) 8.17 (18) 9.25 6.91
RISK VS. RETURN 12.0 8.0 4.0 Return (% ) 0.0 -4.0 -8.0 0.0 Invesco Dev Mkt Median 2018 (14) -12.14 (29) -14.57 -16.46 3 Years Ending Dec-2019 (20) 13.66 (40) 11.57 10.73
(77) (44) (28) (63) (31) (44)
10 Years 1.48 2.66 2.41 2019 23.99 18.42 20.17 3 Years Ending Dec-2020 8.49 6.17 5.63
(69) (47)
Years
7 4.10 4.98 4.84
(83) (57) 2020 (54) (47) 3 Years Ending Dec-2021 (72) (64)
Years 17.22 18.31 17.68 10.37 10.94 11.92
5 2.26 3.68 4.02
(71) (45)
3 Years -8.36 -5.08 -5.62 2021 (84) (58) 3 Years Ending Dec-2022 (90) (44)
(48) (60) -7.50 -2.54 -1.60 -6.73 -2.69 -3.16 66
1 Year 11.17 9.83 10.91
PEER GROUP ANALYSIS - IM Emerging Markets Equity (MF)
(69) (32) (71) (45)
(48) (60) 2022 3 Years Ending Dec-2023
Year To Date 11.17 9.83 10.91 -25.16 -20.09 -22.45 -8.36 -5.08 -5.62
Last Quarter (70) 6.96 (47) 7.86 7.73 CALENDAR YEAR RETURNS AND PERCENTILE RANKINGS ROLLING 3 YEAR RETURN AND PERCENTILE RANKINGS
36.0 28.0 20.0 12.0 Return 4.0 -4.0 -12.0 -20.0 IM Emerging Markets Equity (MF) Median IM Emerging Markets Equity (MF) Median
Invesco Dev Mkt MSCI Emerging Mkts (Net) Index Median Invesco Dev Mkt MSCI EM (Net) Index Invesco Dev Mkt MSCI EM (Net) Index
Invesco Dev Mkt 12/31/23 FUND INFORMATION Invesco Fund Family : 11/18/1996 Fund Inception : Justin Leverenz Portfolio Manager : $2,194 Million Total Assets : 25% Turnover : Investment Strategy: The portfolio manager invests in emerging market businesses that appear likely to grow at a faster pace than world GDP and may benefit from distinctive structural global growth themes. They rely on fundamental analysis