
Page 394 - DCAC February 2024 Files
P. 394
5.52 %
4.97 %
5.54 %
8.70 %
4.38 %
5.03 %
4.42 %
Taiwan Semiconductor Manufacturing
Tata Consultancy Services Ltd ORD
Samsung Electronics Co Ltd ORD
Kotak Mahindra Bank Ltd ORD
Grupo Mexico SAB de CV ORD
Yum China Holdings Inc ORD
TOP 10 HOLDINGS
HDFC Bank Ltd ORD
93.9%
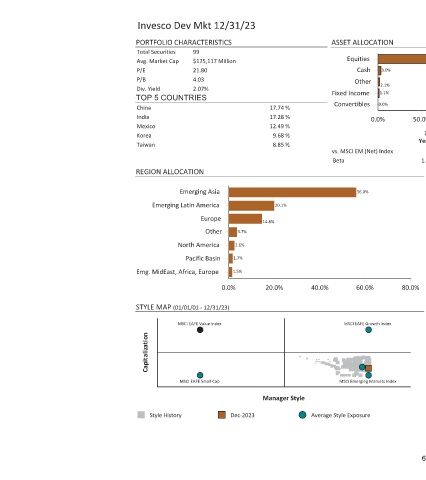
50.0% 4.14 % Pernod Ricard SA ORD 150.0% 100.0% 3.76 % H WORLD GROUP ADR 5 3 3.65 % Compagnie Financiere Richemont Years Years 0.99 1.03 SECTOR ALLOCATION 2.0% Telecommunication Services 2.9% Energy Non Classified Equity 3.9% 4.3% Health Care 4.5% Industrials 8.7% Materials 12.1% Consumer Staples 13.3% Consumer Discretionary 17.7% Financials 24.4% Information Technology 32.0%
80.0%
ASSET ALLOCATION Equities 3.0% Cash Other 2.1% 1.1% Fixed Income 0.0% Convertibles 0.0% vs. MSCI EM (Net) Index 56.0% 60.0% MSCI EAFE Growth Index MSCI Emerging Markets Index
Beta
40.0% Average Style Exposure
17.74 % 17.28 % 12.49 % 9.68 % 8.85 % 20.1% 20.0% Manager Style
14.8% 3.7% 2.6% 1.7% 1.5% Dec-2023
Invesco Dev Mkt 12/31/23 PORTFOLIO CHARACTERISTICS 99 Total Securities $125,117 Million Avg. Market Cap 21.80 P/E 4.03 P/B 2.07% Div. Yield TOP 5 COUNTRIES China India Mexico Korea Taiwan REGION ALLOCATION Emerging Asia Emerging Latin America Europe Other North America Pacific Basin Emg. MidEast, Africa, Europe 0.0% (01/01/01 - 12/31/23) STYLE MAP MSCI EAFE Value Index Capitalization MSCI EAFE Sm