
Page 400 - DCAC February 2024 Files
P. 400
10.0
7.5
Risk (Standard Deviation %)
5.0
(5 YEARS*)
2.5
RISK VS. RETURN
0.0
-2.5
3.6
2.7
1.8
0.9
0.0
-0.9
-1.8
Return (%)
Years
10
Years
7
Years
5
Years
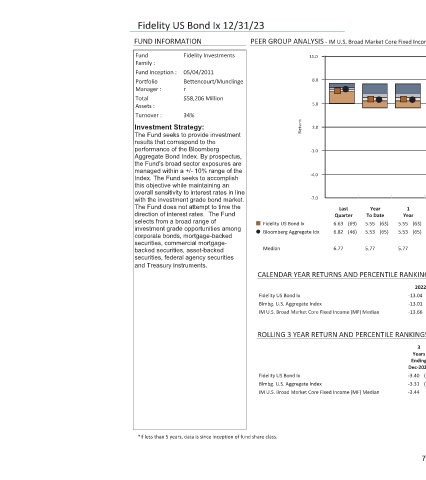
PEER GROUP ANALYSIS - IM U.S. Broad Market Core Fixed Income (MF)
3
(63) Standard Return Deviation (49) 1.78 (54) 1.26 (61) 1.06 (47) -3.40 6.11 1.06 Fidelity US Bond Ix (46) 1.81 (50) 1.29 (58) 1.10 (38) -3.31 (65) 6.11 1.10 Bloomberg Aggregate Idx 6.46 1.19 Median 1.77 1.29 1.19 -3.44 2016 2017 2018 2019 2020 2021 2022 (68) 2.51 (56) 3.49 (18) 0.03 (65) 8.48 (62) 7.80 (73) -1.79
1 Year 5.55 5.53 5.77
Year To Date (63) 5.55 (65) 5.53 5.77
Last Quarter (69) 6.63 (46) 6.82 6.77 CALENDAR YEAR RETURNS AND PERCENTILE RANKINGS ROLLING 3 YEAR RETURN AND PERCENTILE RANKINGS
11.0 8.0 5.0 2.0 Return -1.0 -4.0 -7.0 IM U.S. Broad Market Core Fixed Income (MF) Median IM U.S. Broad Market Core Fixed Income (MF) Median
Fidelity US Bond Ix Bloomberg Aggregate Idx Median Fidelity US Bond Ix Blmbg. U.S. Aggregate Index Fidelity US Bond Ix Blmbg. U.S. Aggregate Index
Fidelity US Bond Ix 12/31/23 FUND INFORMATION Fidelity Investments Fund Family : 05/04/2011 Fund Inception : Bettencourt/Munclinge Portfolio r Manager : $58,206 Million Total Assets : 34% Turnover : Investment Strategy: The Fund seeks to provide investment results that correspond to the performance of the Bloomberg Aggregate Bond Index. By prospectus, the Fund's broad sector exposures are managed within a +/-