
Page 405 - DCAC February 2024 Files
P. 405
10.0 (64) (62) (15) (44)
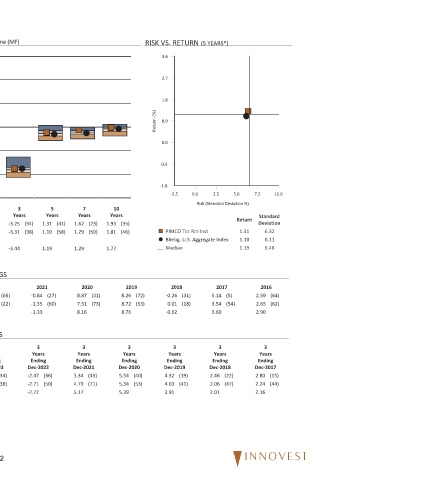
Standard Deviation 6.32 6.11 6.46 2016 3 Years Ending Dec-2017
7.5 2.59 2.65 2.90 2.80 2.24 2.16
5.0 Return 1.31 1.10 1.19 (5) (54) (22) (47)
(5 YEARS*) 2.5 0.0 Risk (Standard Deviation %) Blmbg. U.S. Aggregate Index 2017 5.14 3.54 3.60 3 Years Ending Dec-2018 2.46 2.06 2.01
RISK VS. RETURN 3.6 2.7 1.8 0.9 0.0 -0.9 -1.8 -2.5 PIMCO Tot Rtn Inst Median 2018 (31) -0.26 (18) 0.01 -0.62 3 Years Ending Dec-2019 (19) 4.32 (41) 4.03 3.91
Return (%)
(72) (53) (40) (53)
2019 Years Ending Dec-2020
(35) (46) 8.26 8.72 8.76 3 5.54 5.34 5.39
10 Years 1.93 1.81 1.77
(23) (50) (31) (73) (43) (71)
7 Years 1.62 1.29 1.29 2020 8.87 7.51 8.16 3 Years Ending Dec-2021 5.34 4.79 5.17
(41) (58)
5 Years (27) (60) (36) (50)
1.19
1.31
1.10
2021 -0.84 -1.55 -1.33 3 Years Ending Dec-2022
(34) (38) -2.47 -2.71 -2.72
3 Years -3.25 -3.31 -3.44
PEER GROUP ANALYSIS - IM U.S. Broad Market Core Fixed Income (MF)
(65) (22) (34) (38)
(26) (65) 2022 3 Years Ending Dec-2023 72
Year -14.08 -13.01 -13.66 -3.25 -3.31 -3.44
1
6.30 5.53 5.77
Year To Date (26) 6.30 (65) 5.53 5.77
Last Quarter (35) 6.93 (46) 6.82 6.77 CALENDAR YEAR RETURNS AND PERCENTILE RANKINGS ROLLING 3 YEAR RETURN AND PERCENTILE RANKINGS
11.0 8.0 5.0 2.0 Return -1.0 -4.0 -7.0 IM U.S. Broad Market Core Fixed Income (MF) Median IM U.S. Broad Market Core Fixed Income (MF) Median
PIMCO Tot Rtn Inst Blmbg. U.S. Aggregate Index Median PIMCO Tot Rtn Inst Blmbg. U.S. Aggregate Index PIMCO Tot Rtn Inst Blmbg. U.S. Aggregate Index
PIMCO Tot Rtn Inst 12/31/23 FUND INFORMATION PIMCO Fund Family : 05/11/1987 Fund Inception : Team Managed Portfolio Manager : $43,495 Million Total Assets : 377% Turnover : Investment Strategy: The fund aims to provide investors with a combination of income and capital appreciation potential. It emphasizes higher-quality, intermediate-term bonds and aims to avoid concentration risk by being more globally diver