Page 75 - DCAC November 2024 Files
P. 75

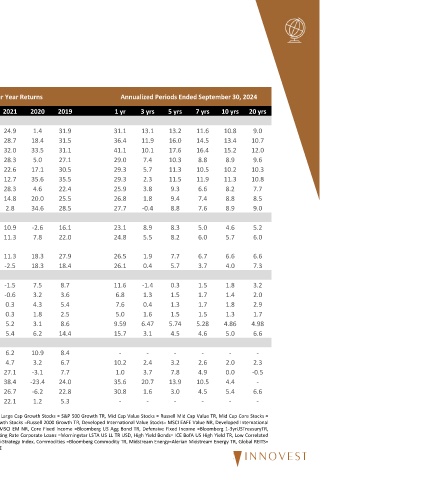
20 yrs   10 yrs  9.0  10.8  10.7  13.4  12.0  15.2  9.6  8.9  10.3  10.2  10.8  11.3  7.7  8.2  8.5  8.8  9.0  8.9  5.2  4.6  6.0  5.7  6.6  6.6  7.3  4.0  3.2  1.8  2.0  1.4  2.9  1.8  1.7  1.3  4.98  4.86  6.6  5.0  ‐  ‐  2.3  2.0  ‐0.5  0.0  ‐  4.4  6.6  5.4  ‐  ‐  1‐3yrUSTreasuryTR,
                       Annualized Periods Ended September 30, 2024  7 yrs  5 yrs  11.6  13.2  14.5  16.0  16.4  17.6  8.8  10.3  10.5  11.3  11.9  11.5  6.6  9.3  7.4  9.4  7.6  8.8  5.0  8.3  6.0  8.2  6.7  7.7  3.7  5.7  1.5  0.3  1.7  1.5  1.7  1.3  1.5  1.5  5.28  5.74  4.6  4.5  ‐  ‐  2.6  3.2  4.9  7.8  10.5  13.9  4.5  3.0  ‐  ‐  =Bloomberg  Income  Fixed


                           1 yr  3 yrs  13.1  31.1  11.9  36.4  10.1  41.1  7.4  29.0  5.7  29.3  2.3  29.3  3.8  25.9  1.8  26.8  ‐0.4  27.7  8.9  23.1  5.5  24.8  1.9  26.5  0.4  26.1  ‐1.4  11.6  1.3  6.8  0.4  7.6  1.6  5.0  6.47  9.59  3.1  15.7  ‐  ‐  2.4  10.2  3.7  1.0  20.7  35.6  1.6  30.8  ‐  ‐  Defensive  TR,  Bond  Agg

                                                                                                  US
                                                                                                  =Bloomberg


                           2019  31.9  31.5  31.1  27.1  30.5  35.5  22.4  25.5  28.5  16.1  22.0  27.9  18.4  8.7  3.6  5.4  2.5  8.6  14.4  8.4  6.7  7.7  24.0  22.8  5.3  Income
                                                                                                  Fixed  Core
                                                                                       ‐23.4
                           2020
                                          35.6
                                   33.5
                                                                                     ‐3.1
                                                     ‐2.6
                                        17.1
                                                                                 10.9
                                                                                          ‐6.2
                                              20.0
                                                             18.3
                                                           18.3
                                 18.4
                                                34.6
                                                                             6.2
                       Calendar Year Returns  2021  24.9  28.7  32.0  28.3  22.6  12.7  28.3  14.8  2.8  10.9  11.3  11.3  ‐2.5  ‐1.5  ‐0.6  0.3  0.3  5.2  5.4  6.2  4.7  27.1  38.4  26.7  22.1 Returns based off the following indices: Large Cap Value Stocks = S&P 500 Value TR, Large Cap Core Stocks = S&P 500 TR, Large Cap Growth Stocks = S&P 500 Growth TR, Mid Cap Value Stocks = Russell Mid Cap Value TR, Mid Cap Core Stocks = Ru
                                                       7.8
                                                                  7.5
                                                                    3.2
                                                                      4.3
                                                                        1.8
                                                                                   3.2
                               1.4
                                                                                            1.2
                                     5.0
                                            4.6
                                                                          3.1
                                                                             ‐11.2
                                                                                          ‐24.3
                                                                  ‐13.0
                                                             ‐20.1
                                        ‐17.3
                                          ‐26.7
                                            ‐14.5
                                 ‐18.1
                                   ‐29.4
                                     ‐12.0
                                              ‐20.4
                                                ‐26.4
                                                           ‐22.9
                                                       ‐14.5
                           2022
                                                                                   ‐5.6
                                                                                       21.5
                               ‐5.2
                                                                                     16.1
                                                                          ‐0.8
                                                                      ‐5.3
                                                                        ‐1.1
                                                                                 ‐5.3
                                                     ‐5.6
                                                                    ‐3.8
                                                                                            7.5
                                                                                                  Markets  Stocks=
                           2023  22.2  26.3  30.0  12.7  17.2  25.9  14.6  16.9  18.7  19.0  18.2  17.6  9.8  5.5  4.3  4.3  3.4  13.3  13.5  6.1  6.2  ‐7.9  14.0  11.6  ‐12.0  Emerging
                                                                                                  NR,
                                                                                                  Growth  EAFE
                      Periods Ended   September 30, 2024  YTD  QTD  15.4  9.1  22.1  5.9  28.2  3.7  15.1  10.1  14.6  9.2  12.9  6.5  9.2  10.2  11.2  9.3  13.2  8.4  13.8  8.9  13.0  7.3  12.3  5.7  16.9  8.7  4.4  5.2  4.1  2.9  2.2  3.0  2.6  1.6  6.54  2.04  8.0  5.3  ‐  ‐  6.3  2.6  5.9  0.7  27.4  9.7  13.1  16.5  ‐  ‐  Stocks=MSCI  Growth S&P Developed Property TR, Direct Real Estate (Current Quarter, YTD, and Annualized
                Investment Returns Over Time
                           Broad Market Indices      Developed International Value Stocks Developed International Core Stocks Developed International Growth   Defensive Municipal Fixed Income Floating Rate Corporate Loans   Low Correlated Hedge Funds Liquid Low Correlated Hedge Funds  International Developed  NR,  EAFE
                             Domestic Equities  Large Cap Value Stocks  Large Cap Core Stocks Large Cap Growth Stocks  Mid Cap Value Stocks  Mid Cap Core Stocks  Mid Cap Growth Stocks  Small Cap Value Stocks  Small Cap Core Stocks  Small Cap Growth Stocks  International Equities  Stocks  Emerging Markets Stocks   Fixed Income  Core Fixed Income   Defensive Fixed Income  Municipal Fixed Income  High Yield Fixed Income Diversifyin
   70   71   72   73   74   75   76   77   78   79   80