
Page 295 - DCAC Feb 2026 Files
P. 295
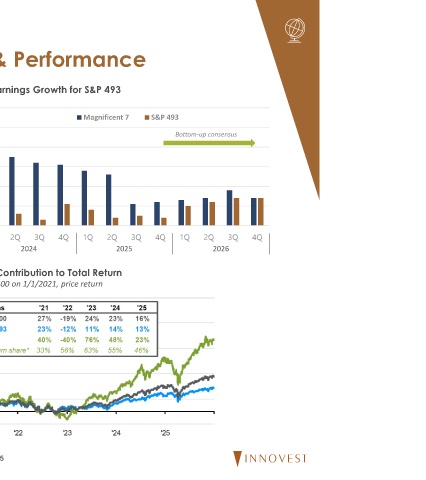
S&P 493 Earnings Growth & Performance


 Robust Earnings Growth for S&P 493
 60%
 • Earnings growth for the S&P
                    Magnificent 7  S&P 493
 500 ex- the Magnificent 7 have   50%
                                         Bottom-up consensus
 recently been showing   40%
 strength. Additionally, the
 historical performance of the   30%

 Magnificent 7 may have been   20%
 justified by its sizable earnings   10%
 growth.
 0%
 1Q  2Q  3Q   4Q    1Q   2Q    3Q   4Q   1Q    2Q   3Q    4Q
 • S&P 500 Index concentration,
      2024                 2025                  2026
 as measured by the

 Magnificent Seven’s   S&P 493 Contribution to Total Return
 contribution to total index   Indexed to 100 on 1/1/2021, price return
 returns, peaked in 2023.
 However, the Magnificent
 Seven continue to play a large
 role in the index’s returns and
 earnings growth.


 Sources: Top: Goldman Sachs, Aptus Capital Advisors, data as of 8/15/25.
 Bottom: FactSet, Standard and Poor’s, J.P. Morgan Asset Management.
 Magnificent 7 (Mag 7) includes AAPL, AMZN, GOOGL/GOOG, META, MSFT, NVDA
 and TSLA. The S&P 500 ex-Mag 7 (S&P 493) is calculated by backing out a
 weighted average Mag 7 price return from the S&P 500 price return. Data as of
 12/31/25.


 25