
Page 297 - DCAC Feb 2026 Files
P. 297
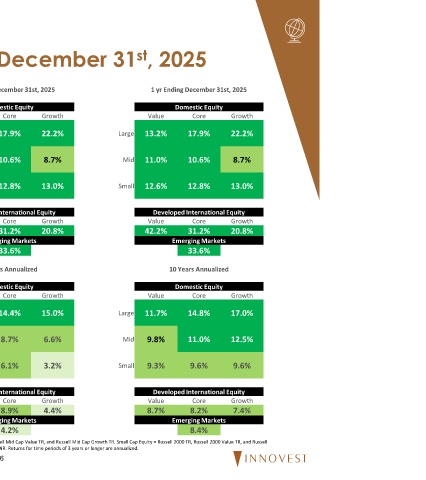
Equity Performance as of December 31 , 2025
                                st


 4th Quarter 2025  YTD as of December 31st, 2025  1 yr Ending December 31st, 2025

 Domestic Equity  Domestic Equity       Domestic Equity
 Value  Core  Growth  Value  Core  Growth  Value  Core  Growth
 Large  3.2%  2.7%  2.2%  Large  13.2%  17.9%  22.2%  Large  13.2%  17.9%  22.2%


 Mid  1.4%  0.2%  -3.7%  Mid  11.0%  10.6%  8.7%  Mid  11.0%  10.6%  8.7%


 Small  3.3%  2.2%  1.2%  Small  12.6%  12.8%  13.0%  Small  12.6%  12.8%  13.0%

 Developed International Equity  Developed International Equity  Developed International Equity
 Value  Core  Growth  Value  Core  Growth  Value  Core  Growth
 7.8%  4.9%  1.9%  42.2%  31.2%  20.8%  42.2%  31.2%  20.8%
 Emerging Markets  Emerging Markets     Emerging Markets
 4.7%  33.6%                               33.6%
 3 Years Annualized  5 Years Annualized  10 Years Annualized

 Domestic Equity  Domestic Equity       Domestic Equity
 Value  Core  Growth  Value  Core  Growth  Value  Core  Growth

 Large  15.8%  23.0%  29.3%  Large  13.0%  14.4%  15.0%  Large  11.7%  14.8%  17.0%

 Mid  12.3%  14.4%  18.6%  Mid  9.8%  8.7%  6.6%  Mid  9.8%  11.0%  12.5%


 Small  11.7%  13.7%  15.6%  Small  8.9%  6.1%  3.2%  Small  9.3%  9.6%  9.6%


 Developed International Equity  Developed International Equity  Developed International Equity
 Value  Core  Growth  Value  Core  Growth  Value  Core  Growth
 21.4%  17.2%  13.2%  13.4%  8.9%  4.4%  8.7%  8.2%   7.4%
 Emerging Markets  Emerging Markets     Emerging Markets
 16.4%  4.2%                                8.4%
 Large Cap Equity = S&P 500 TR, S&P 500 Value TR, and S&P 500 Growth TR. Mid Cap Equity = Russell Mid Cap TR, Russell Mid Cap Value TR, and Russell Mid Cap Growth TR. Small Cap Equity = Russell 2000 TR, Russell 2000 Value TR, and Russell
 2000 Growth TR. International and EM Equity = MSCI EAFE NR, MSCI EAFE Value NR, MSCI EAFE Growth NR, MSCI EM NR. Returns for time periods of 3 years or longer are annualized.
 26