
Page 309 - DCAC Feb 2026 Files
P. 309
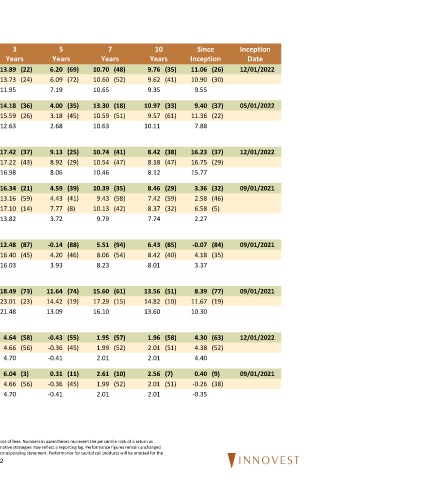
457 & 401(a) Table of Returns
 Last  1  3   5          7          10       Since     Inception
 Quarter  2025  Year  Years  Years  Years  Years  Inception  Date
 Fidelity Small Cap Index  2.22 (36)  12.93 (16)  12.93 (16)  13.89 (22)  6.20 (69)  10.70 (48)  9.76 (35)  11.06 (26)  12/01/2022
 Russell 2000 Index  2.19 (39)  12.81 (18)  12.81 (18)  13.73 (24)  6.09 (72)  10.60 (52)  9.62 (41)  10.90 (30)
 Small Blend Median  1.89  8.22  8.22  11.95  7.19  10.65  9.35  9.55
 Harbor Small Cap Growth  3.09 (34)  11.43 (32)  11.43 (32)  14.18 (36)  4.00 (35)  13.30 (18)  10.97 (33)  9.40 (37)  05/01/2022
 Russell 2000 Growth Index  1.22 (64)  13.01 (22)  13.01 (22)  15.59 (26)  3.18 (45)  10.59 (51)  9.57 (61)  11.36 (22)
 Small Growth Median  1.87  8.86  8.86  12.63  2.68  10.63  10.11  7.88

 International Equity
 Fidelity International Index  4.59 (41)  31.96 (42)  31.96 (42)  17.42 (37)  9.13 (25)  10.74 (41)  8.42 (38)  16.23 (37)  12/01/2022
 MSCI EAFE (Net)  4.86 (32)  31.22 (50)  31.22 (50)  17.22 (43)  8.92 (29)  10.54 (47)  8.18 (47)  16.75 (29)
 Foreign Large Blend Median  4.36  31.18  31.18  16.98  8.06  10.46  8.12  15.77
 American Funds EUPAC  4.62 (3)  29.18 (7)  29.18 (7)  16.34 (21)  4.59 (39)  10.39 (35)  8.46 (29)  3.36 (32)  09/01/2021
 MSCI EAFE Growth Index (Net)  1.86 (41)  20.76 (43)  20.76 (43)  13.16 (59)  4.43 (41)  9.43 (58)  7.42 (59)  2.58 (46)
 MSCI AC World ex USA IMI (Net)  4.76 (3)  31.96 (4)  31.96 (4)  17.10 (14)  7.77 (8)  10.13 (42)  8.37 (32)  6.58 (5)
 Foreign Large Growth Median  1.36  19.81  19.81  13.82  3.72  9.79  7.74  2.27

 Emerging Markets Equity
 Invesco Developing Markets  4.97 (40)  28.84 (68)  28.84 (68)  12.48 (87)  -0.14 (88)  5.51 (94)  6.43 (85)  -0.07 (84)  09/01/2021
 MSCI Emerging Markets (Net)  4.73 (45)  33.57 (38)  33.57 (38)  16.40 (45)  4.20 (46)  8.06 (54)  8.42 (40)  4.18 (35)
 Diversified Emerging Mkts Median  4.46  31.79  31.79  16.03  3.93  8.23  8.01  3.37
 Socially Responsible
 Parnassus Core Equity  1.65 (74)  11.88 (83)  11.88 (83)  18.49 (73)  11.64 (74)  15.60 (61)  13.56 (51)  8.39 (77)  09/01/2021
 S&P 500 Index  2.66 (33)  17.88 (24)  17.88 (24)  23.01 (23)  14.42 (19)  17.29 (15)  14.82 (10)  11.67 (19)
 Large Blend Median  2.42  16.43  16.43  21.48  13.09  16.10  13.60  10.30

 Fixed Income
 Fidelity US Bond Index  1.02 (39)  7.13 (52)  7.13 (52)  4.64 (58)  -0.43 (55)  1.95 (57)  1.96 (58)  4.30 (63)  12/01/2022
 Blmbg. U.S. Aggregate Index  1.10 (23)  7.30 (36)  7.30 (36)  4.66 (56)  -0.36 (45)  1.99 (52)  2.01 (51)  4.38 (52)
 Intermediate Core Bond Median  0.99  7.14  7.14  4.70  -0.41  2.01  2.01  4.40
 PIMCO Total Return  1.71 (1)  9.33 (1)  9.33 (1)  6.04 (3)  0.31 (11)  2.61 (10)  2.56 (7)  0.40 (9)  09/01/2021
 Blmbg. U.S. Aggregate Index  1.10 (23)  7.30 (36)  7.30 (36)  4.66 (56)  -0.36 (45)  1.99 (52)  2.01 (51)  -0.26 (38)
 Intermediate Core Bond Median  0.99  7.14  7.14  4.70  -0.41  2.01  2.01  -0.35


 Mutual fund and ETF returns are reported net of fees, unless otherwise stated, and are provided by the product manager. Real Estate returns are gross of fees. Numbers in parentheses represent the percentile rank of a return as
 compared to a universe of funds using similar investment strategies. Returns for periods longer than one year are annualized. Performance for alternative strategies may reflect a reporting lag. Performance figures remain unchanged
 until an updated statement with revised performance data is received. Historical total return performance is similarly updated upon receipt of the corresponding statement. Performance for capital call products will be omitted for the
 first three years following the fund’s inception, if applicable.  32