
Page 313 - DCAC Feb 2026 Files
P. 313
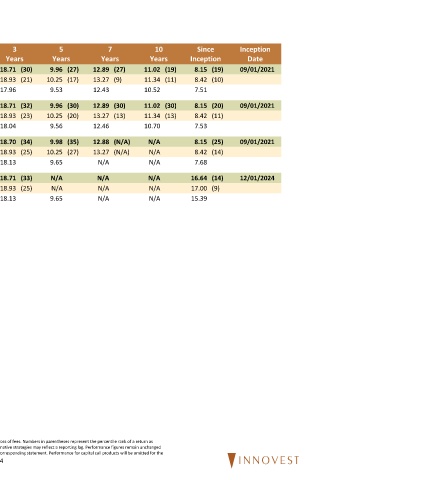
457 & 401(a) Table of Returns
 Last  1  3   5          7          10       Since     Inception
 Quarter  2025  Year  Years  Years  Years  Years  Inception  Date
 Vanguard Target Retirement 2055  3.06 (32)  21.43 (15)  21.43 (15)  18.71 (30)  9.96 (27)  12.89 (27)  11.02 (19)  8.15 (19)  09/01/2021
 Vanguard Target 2055 Composite Index  3.21 (20)  21.49 (13)  21.49 (13)  18.93 (21)  10.25 (17)  13.27 (9)  11.34 (11)  8.42 (10)
 Target-Date 2055 Median  2.94  19.89  19.89  17.96  9.53  12.43  10.52  7.51
 Vanguard Target Retirement 2060  3.06 (37)  21.42 (16)  21.42 (16)  18.71 (32)  9.96 (30)  12.89 (30)  11.02 (30)  8.15 (20)  09/01/2021
 Vanguard Target 2060 Composite Index  3.21 (21)  21.49 (13)  21.49 (13)  18.93 (23)  10.25 (20)  13.27 (13)  11.34 (13)  8.42 (11)
 Target-Date 2060 Median  2.94  19.94  19.94  18.04  9.56  12.46  10.70  7.53

 Vanguard Target Retirement 2065  3.07 (36)  21.43 (22)  21.43 (22)  18.70 (34)  9.98 (35)  12.88 (N/A)  N/A  8.15 (25)  09/01/2021
 Vanguard Target 2065 Composite Index  3.21 (20)  21.49 (20)  21.49 (20)  18.93 (25)  10.25 (27)  13.27 (N/A)  N/A  8.42 (14)
 Target-Date 2065+ Median  2.98  20.38  20.38  18.13  9.65  N/A  N/A  7.68

 Vanguard Target Retirement 2070  3.07 (35)  21.42 (24)  21.42 (24)  18.71 (33)  N/A  N/A  N/A  16.64 (14)  12/01/2024
 Vanguard Target 2070 Composite Index  3.21 (20)  21.49 (20)  21.49 (20)  18.93 (25)  N/A  N/A  N/A  17.00 (9)
 Target-Date 2065+ Median  2.98  20.38  20.38  18.13  9.65  N/A  N/A  15.39


 Mutual fund and ETF returns are reported net of fees, unless otherwise stated, and are provided by the product manager. Real Estate returns are gross of fees. Numbers in parentheses represent the percentile rank of a return as
 compared to a universe of funds using similar investment strategies. Returns for periods longer than one year are annualized. Performance for alternative strategies may reflect a reporting lag. Performance figures remain unchanged
 until an updated statement with revised performance data is received. Historical total return performance is similarly updated upon receipt of the corresponding statement. Performance for capital call products will be omitted for the
 first three years following the fund’s inception, if applicable.  34