
Page 329 - DCAC Feb 2026 Files
P. 329
Fidelity 500 Index 12/31/25
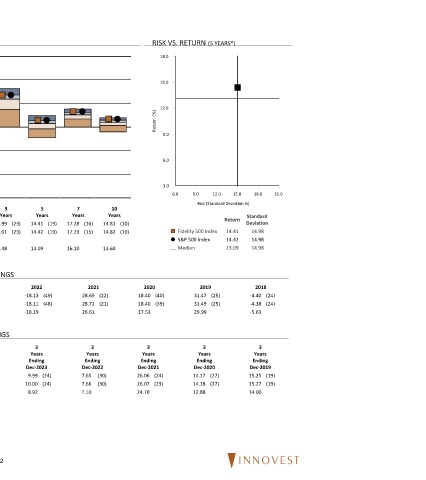
FUND INFORMATION PEER GROUP ANALYSIS - Large Blend RISK VS. RETURN (5 YEARS*)
Fund Fidelity Investments 36.0 18.0
Family:
Fund Inception: 05/04/2011
Portfolio Team Managed 28.0 15.0
Manager:
Total 740,015 Million
Assets: 20.0 12.0
Turnover 3.00 %
Return 12.0 Return (%)
Firm and Management: 9.0
Fidelity was founded in 1946 by
Edward Johnson II and headquartered 4.0
in Boston, MA. Fidelity has investment 6.0
funds that span from domestic markets
to the international stage and manages -4.0
nearly $13 trillion in assets under
administration. This fund is sub advised 3.0
by Geode Capital Management and 6.0 9.0 12.0 15.0 18.0 21.0
has five portfolio managers on the fund, -12.0 Risk (Standard Deviation %)
co-led by Louis Bottari and Peter Last Year 1 3 5 7 10
Matthew. Quarter To Date Year Years Years Years Years Return Standard
¢ £ Fidelity 500 Index 2.65 (33) 17.86 (25) 17.86 (25) 22.99 (23) 14.41 (19) 17.28 (16) 14.81 (10) Deviation
Investment Strategy: S&P 500 Index 2.66 (33) 17.88 (24) 17.88 (24) 23.01 (23) 14.42 (19) 17.29 (15) 14.82 (10) ¢ £ Fidelity 500 Index 14.41 14.98
The fund employs a "passive S&P 500 Index 14.42 14.98
management" -or indexing-investment Median 2.42 16.43 16.43 21.48 13.09 16.10 13.60 ¾ Median 13.09 14.98
approach designed to mimic the
performance of the S&P 500 Index, a
broadly diversified index of stocks of
predominantly large U.S. companies. CALENDAR YEAR RETURNS AND PERCENTILE RANKINGS
The fund attempts to replicate the
target index by investing all, or 2024 2023 2022 2021 2020 2019 2018
substantially all, of its assets in the Fidelity 500 Index 25.00 (25) 26.29 (26) -18.13 (49) 28.69 (22) 18.40 (40) 31.47 (25) -4.40 (24)
stocks that make up the index, S&P 500 Index 25.02 (25) 26.29 (26) -18.11 (48) 28.71 (21) 18.40 (39) 31.49 (25) -4.38 (24)
including index futures. The funds Large Blend Median 23.22 24.61 -18.19 26.61 17.53 29.99 -5.63
subadvisor, Geode Capital
Management, uses pure replication,
statistical sampling, and portfolio ROLLING 3 YEAR RETURN AND PERCENTILE RANKINGS
optimization techniques to create
comparable performance to the S&P 3 3 3 3 3 3 3
500. Years Years Years Years Years Years Years
Ending Ending Ending Ending Ending Ending Ending
Innovest Assessment: Dec-2025 Dec-2024 Dec-2023 Dec-2022 Dec-2021 Dec-2020 Dec-2019
As an index fund, this fund is expected Fidelity 500 Index 22.99 (23) 8.93 (24) 9.99 (24) 7.65 (30) 26.06 (24) 14.17 (27) 15.25 (19)
to closely track its benchmark with S&P 500 Index 23.01 (23) 8.94 (24) 10.00 (24) 7.66 (30) 26.07 (23) 14.18 (27) 15.27 (19)
minimal tracking error. Large Blend Median 21.48 7.81 8.92 7.10 24.70 12.88 14.00
*If less than 5 years, data is since inception of fund share class.
42