
Page 330 - DCAC Feb 2026 Files
P. 330
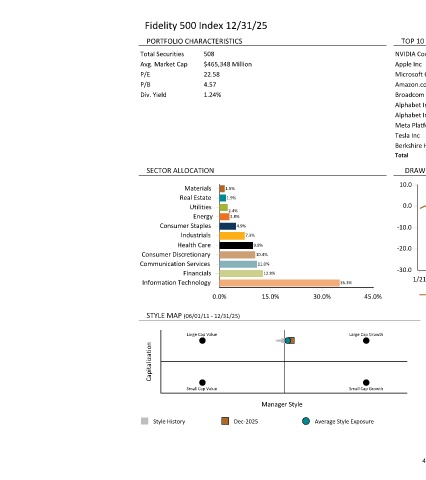
Fidelity 500 Index 12/31/25
                                    PORTFOLIO CHARACTERISTICS                              TOP 10 HOLDINGS
                                 Total Securities  508                                    NVIDIA Corp                                              7.39 %
                                 Avg. Market Cap  $465,348 Million                        Apple Inc                                                7.08 %
                                 P/E           22.58                                      Microsoft Corp                                           6.25 %
                                 P/B           4.57                                       Amazon.com Inc                                           3.87 %
                                 Div. Yield    1.24%                                      Broadcom Inc                                             3.24 %
                                                                                          Alphabet Inc Class A                                     3.19 %
                                                                                          Alphabet Inc Class C                                     2.56 %
                                                                                          Meta Platforms Inc Class A                               2.40 %
                                                                                          Tesla Inc                                                2.06 %
                                                                                          Berkshire Hathaway Inc Class B                           1.61 %
                                                                                          Total                                                   39.65 %
                                  SECTOR ALLOCATION                                             DRAWDOWN ANALYSIS (01/01/21 - 12/31/25)
                                                                                           10.0
                                           Materials  1.5%
                                          Real Estate  1.9%
                                            Utilities                                       0.0
                                                    2.4%
                                             Energy  2.8%
                                     Consumer Staples  4.9%                               -10.0
                                          Industrials   7.3%
                                         Health Care      9.8%
                                                                                          -20.0
                                 Consumer Discretionary    10.4%
                                 Communication Services    11.0%
                                                                                          -30.0
                                          Financials        12.8%
                                 Information Technology                       35.3%           1/21   7/21  1/22  7/22   1/23  7/23   1/24  7/24   1/25  7/25  12/25
                                                 0.0%       15.0%       30.0%      45.0%           Fidelity 500 Index  S&P 500 Index

                                  STYLE MAP (06/01/11 - 12/31/25)                                  UP/DOWN CAPTURE (01/01/21 - 12/31/25)
                                                                                                     150.0
                                           Large Cap Value                      Large Cap Growth     125.0
                                   Capitalization                                                   Up Capture     100.0


                                                                                                      75.0
                                                                                                      50.0
                                           Small Cap Value                      Small Cap Growth
                                                                                                         50.0      70.0       90.0      110.0     130.0      150.0
                                                            Manager Style                                                       Down Capture
                                    Style History     Dec-2025          Average Style Exposure       Fidelity 500 Index


                                                                                                43