
Page 487 - DCAC Feb 2026 Files
P. 487
• Growth: Women’s average contributions rose from $7,621 to $8,014, a
5.2% year-over-year increase. Participation also grew, from 3,401 to
2024 – 2025 3,446 women participants.
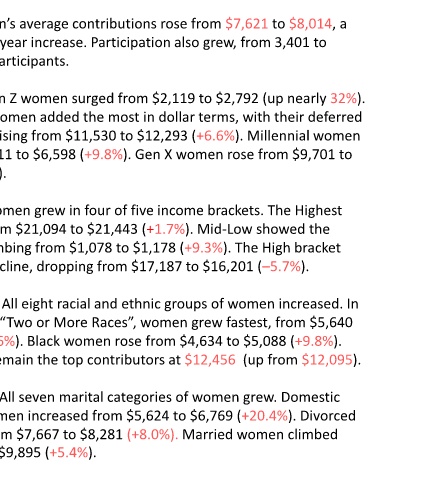
Women’s Deferred • Generation: Gen Z women surged from $2,119 to $2,792 (up nearly 32%).
Baby Boomer women added the most in dollar terms, with their deferred
Compensation compensation rising from $11,530 to $12,293 (+6.6%). Millennial women
Data Trends grew from $6,011 to $6,598 (+9.8%). Gen X women rose from $9,701 to
$10,317 (+6.3%).
• Tax Bracket: Women grew in four of five income brackets. The Highest
bracket rose from $21,094 to $21,443 (+1.7%). Mid-Low showed the
fastest rate, climbing from $1,078 to $1,178 (+9.3%). The High bracket
was the only decline, dropping from $17,187 to $16,201 (–5.7%).
• Race/Ethnicity: All eight racial and ethnic groups of women increased. In
the category of “Two or More Races”, women grew fastest, from $5,640
to $6,576 (+16.6%). Black women rose from $4,634 to $5,088 (+9.8%).
Asian women remain the top contributors at $12,456 (up from $12,095).
• Marital Status: All seven marital categories of women grew. Domestic
Partnership women increased from $5,624 to $6,769 (+20.4%). Divorced
women rose from $7,667 to $8,281 (+8.0%). Married women climbed
from $9,388 to $9,895 (+5.4%).