
Page 79 - FebDefComp
P. 79
Index Returns (%) China Japan EU U.S. 1 Year YTD Global Market Data 6.00 0.60 1.20 2.30 31.49 31.49 GDP Growth (YOY) (%) 4.30 0.50 1.20 2.10 25.52 25.52 CPI (YOY) (%) 3.60 2.40 6.70 3.50 22.01 22.01 Unemployment (%) 4.35 -0.10 0.25 1.75 18.42 18.42 Central Bank Rate (Level) 3.14 -0.01 0.50 1.92 36.69 36.69 10 Year Govt. Yield (%) *Forecasted Q4 2020 1 Year YTD Chart of the Quarter 8.72 8.72 14.54 14.54 14.32 14.32 5.32 5.32 1 Year YTD 7.69 7.69 26.00 26.00 18.31 18.31 22.68 22.68
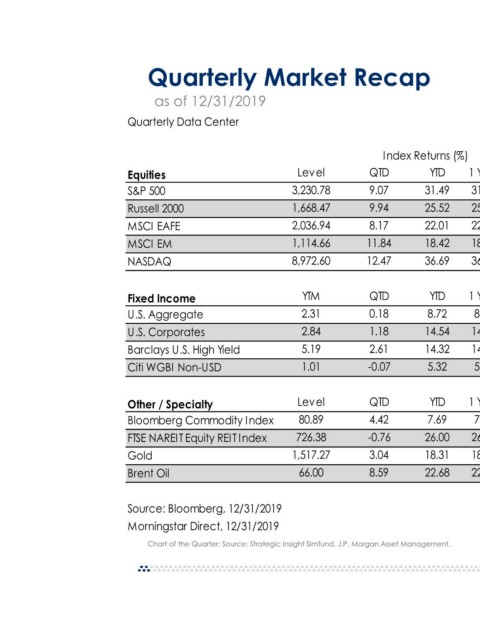
Quarterly Market Recap
QTD 9.07 9.94 8.17 11.84 12.47 QTD 0.18 1.18 2.61 -0.07 QTD 4.42 -0.76 3.04 8.59
Level 3,230.78 1,668.47 2,036.94 1,114.66 8,972.60 YTM 2.31 2.84 5.19 1.01 Level 80.89 726.38 1,517.27 66.00 Chart of the Quarter: Source: Strategic Insight Simfund, J.P. Morgan Asset Management.
as of 12/31/2019 Quarterly Data Center Equities S&P 500 Russell 2000 MSCI EAFE MSCI EM NASDAQ Fixed Income U.S. Aggregate U.S. Corporates Barclays U.S. High Yield Citi WGBI Non-USD Other / Specialty Bloomberg Commodity Index FTSE NAREIT Equity REIT Index Gold Brent Oil Source: Bloomberg, 12/31/2019 Morningstar Direct, 12/31/2019