Page 45 - FebDefComp
P. 45

14
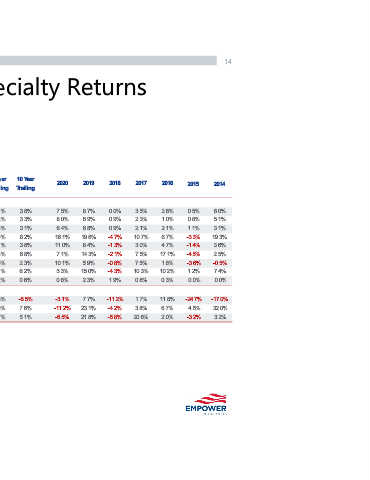
                                                                                 2014          6.0%  5.1%  3.1%  19.3%  3.6%  2.5%  -0.5%  7.4%  %  0  .  0  -17.0%  32.0%  3.2%


                                                                                 2015          0.5%  0.8%  1.1%  -3.3%  -1.4%  -4.5%  -3.6%  1.2%  %  0  .  0  -24.7%  4.5%  -3.2%


                                                                                 2016          2.6%  1.0%  2.1%  6.7%  4.7%  17.1%  1.6%  10.2%  %  3  0.  11.8%  6.7%  2.0%


                                  Fixed Income and Specialty Returns
                                                                                 2017          3.5%  2.3%  2.1%  10.7%  3.0%  7.5%  7.5%  10.3%  0.8%  1.7%  3.8%  20.8%


                                                                                 2018          0.0%  0.9%  0.9%  -4.7%  -1.3%  -2.1%  -0.8%  -4.3%  1.9%  -11.2%  -4.2%  -5.8%


                                                                                 2019          8.7%  6.9%  6.8%  19.6%  8.4%  14.3%  5.9%  15.0%  2.3%  7.7%  23.1%  21.8%


                                                                                 2020          7.5%  8.0%  6.4%  16.1%  11.0%  7.1%  10.1%  5.3%  0.6%  -3.1%  -11.2%  -6.5%


                                                                               ear  railing
                                                                               10 Y  T         3.8%  3.3%  3.1%  8.2%  3.8%  6.8%  2.3%  6.2%  0.6%  -6.5%  7.6%  5.1%


                                                                               ear  Trailing   4.4%  3.8%  3.6%  9.3%  5.1%  8.6%  4.8%  7.1%  1.2%  1.0%  3.0%  5.7%
                                                                               5 Y


                                                                               ear             5.3%  5.2%  4.7%  9.8%  5.9%  6.2%  5.0%  5.0%  1.6%  -2.5%  1.5%  2.4%

                                                                               3 Y  Trailing


                                                                               ear  railing    7.5%  8.0%  6.4%  16.1%  11.0%  7.1%  10.1%  5.3%  0.6%  -3.1%  -11.2%  -6.5%
                                                                               1 Y  T


                                                                                 D
                                                                                 T             7.5%  8.0%  6.4%  16.1%  11.0%  7.1%  10.1%  5.3%  0.6%  -3.1%  -11.2%  -6.5%
                                                                                 Y


                                                                                 D
                                                                                 QT            0.7%  -0.8%  0.5%  1.7%  1.6%  6.5%  2.8%  5.8%  0.0%  10.2%  12.9%  14.0%


                                                                                                        ovt/Cedit Intermedia  ong  orporate High Yeld  i  S                                       Past performance is not a guarantee or prediction of future results.  FOR FINANCIAL PROFESSIONAL AND PLAN SPONSOR USE ONLY.


                                                                                               ggregate  SA     reasury  ST     r   G  S  ovt/Cedit L  r   G  S  S  STP  I      C  S  x U  eveloped E  Source: Morningstar Direct; GWCM Analysis


                                                                                 ecember 31, 2020)  me  arclays U  arclays U  arclays U  arclays U  arclays U  arclays U  BI  I Gobal Dversified  i  l  reasury Bill 3 Month  ommodity  ET  I  elect R  ETD     I  /NAR  A


                                                                                 (as of D   Inco  ed  Fix  loomberg B  B  loomberg B  B  loomberg B  B  loomberg B  B  loomberg B  B  loomberg B  B  G  EW     S  FT  MB  M E  JP  ET     S  FT  ialty  ec  p  S  loomberg C  B   S  S  DJU     PR   E  E  S  FT
   40   41   42   43   44   45   46   47   48   49   50