
Page 156 - MayDefComp
P. 156
Small Cap Growth Fund - WTIXLX Release Date: 12-31-2019
..........................................................................................................................................................................................................................................................................................................................................
Benchmark Fee Class Overall Morningstar Rating™ Morningstar Return Morningstar Risk
Russell 2000 Growth TR USD I1 . . .
Out of 571 Small Growth investments. An investment's overall Morningstar Rating, based on its risk-adjusted
return, is a weighted average of its applicable 3-, 5-, and 10-year Ratings. See disclosure page for details.
Investment Information Performance
Investment Objective & Strategy 40 Total Return %
The Fund will be invested solely in units of the Victory RS 30 as of 12-31-19
Small Cap Growth Collective Fund, which seeks to deliver 20 Investment
long-term capital growth through a disciplined, research- 10 Benchmark
intensive approach that discovers and invests in dynamic, 0
small-cap companies exhibiting sustainable earnings growth -10
potential that can grow to mid- and large-cap companies.
-20 Average annual, if greater
Operations and Management -30 than 1 year
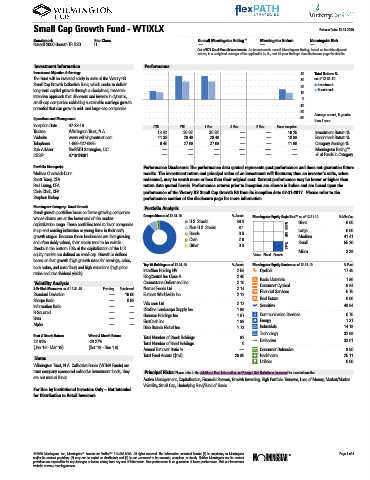
Inception Date 07-22-19 QTD YTD 1 Year 3 Year 5 Year Since Inception
Trustee Wilmington Trust, N.A. 13.32 36.92 36.92 . . 16.25 Investment Return %
Website www.wilmingtontrust.com 11.39 28.48 28.48 . . 10.88 Benchmark Return %
11.99
9.46
Category Average %
27.68
27.68
.
.
Telephone 1-866-427-6885 ..........................................................................................................................................................................................................
Sub-Advisor flexPATH Strategies, LLC . . . . . . Morningstar Rating™
CUSIP 97181N361 . . . . . . # of Funds in Category
Portfolio Manager(s) Performance Disclosure: The performance data quoted represents past performance and does not guarantee future
Melissa Chadwick-Dunn results. The investment return and principal value of an investment will fluctuate; thus an investor’s units, when
YTD
YTD
YTD
YTD
Scott Tracy, CFA redeemed, may be worth more or less than their original cost. Current performance may be lower or higher than
Paul Leung, CFA return data quoted herein. Performance returns prior to inception are shown in italics and are based upon the
Chris Clark, CFA performance of the Victory RS Small Cap Growth R6 from its inception date 07-31-2017. Please refer to the
Stephen Bishop performance section of the disclosure page for more information.
Morningstar Category: Small Growth Portfolio Analysis
Small-growth portfolios focus on faster-growing companies
whose shares are at the lower end of the market- Composition as of 12-31-19 U.S. Stocks % Assets Morningstar Equity Style Box™ as of 12-31-19 % Mkt Cap
89.3
capitalization range. These portfolios tend to favor companies Non-U.S. Stocks 8.1 Large Giant 0.00
........................................................
in up-and-coming industries or young firms in their early Bonds 0.0 Large 0.00
growth stages. Because these businesses are fast-growing Cash 2.6 Mid Medium 41.41
and often richly valued, their stocks tend to be volatile. Other 0.0 Small Small 55.20
........................................................
Stocks in the bottom 10% of the capitalization of the U.S. Micro 3.39
equity market are defined as small cap. Growth is defined Value Blend Growth
based on fast growth (high growth rates for earnings, sales,
book value, and cash flow) and high valuations (high price Top 10 Holdings as of 12-31-19 % Assets Morningstar Equity Sectors as of 12-31-19 % Fund
ratios and low dividend yields). InterXion Holding NV 2.59 h Cyclical 17.45
.......................................................................................................
RingCentral Inc Class A 2.40 r Basic Materials 1.86
Volatility Analysis Cornerstone OnDemand Inc 2.16 t Consumer Cyclical 9.84
3-Yr Risk Measures as of 12-31-19 Port Avg Benchmark Nomad Foods Ltd 2.14 y Financial Services 5.75
Standard Deviation . 16.60 Euronet Worldwide Inc 2.12
Sharpe Ratio . 0.69 ....................................................................................................... u Real Estate 0.00
2.12
Wix.com Ltd
Information Ratio . . SiteOne Landscape Supply Inc 1.99 j Sensitive 48.94
.......................................................................................................
R-Squared . . Generac Holdings Inc 1.97 i Communication Services 0.75
Beta . . FirstCash Inc 1.88 o Energy 1.31
Alpha . .
Dine Brands Global Inc 1.73 p Industrials 14.19
....................................................................................................... a Technology 32.69
Best 3 Month Return Worst 3 Month Return Total Number of Stock Holdings 92
22.84% -23.27% Total Number of Bond Holdings 0 k Defensive 33.61
.......................................................................................................
(Jan '19 - Mar '19) (Oct '18 - Dec '18) Annual Turnover Ratio % . s Consumer Defensive 8.50
Total Fund Assets ($mil) 28.85 d Healthcare 25.11
Notes
Wilmington Trust, N.A. Collective Funds (WTNA Funds) are f Utilities 0.00
trust company sponsored collective investment funds; they Principal Risks: Please refer to the Additional Fund Information and Principal Risk Definitions document for more information.
are not mutual funds. Active Management, Capitalization, Financial Sectors, Growth Investing, High Portfolio Turnover, Loss of Money, Market/Market
Volatility, Small Cap, Underlying Fund/Fund of Funds
For Use by Institutional Investors Only – Not Intended
for Distribution to Retail Investors
©2020 Morningstar, Inc., Morningstar ® Investment Profiles TM 312-696-6000. All rights reserved. The information contained herein: (1) is proprietary to Morningstar ® Page 1 of 4
and/or its content providers; (2) may not be copied or distributed; and (3) is not warranted to be accurate, complete, or timely. Neither Morningstar nor its content ß
providers are responsible for any damages or losses arising from any use of information. Past performance is no guarantee of future performance. Visit our investment
website at www.morningstar.com.