
Page 18 - MayDefComp
P. 18
Index Returns (%) China Japan EU U.S. 1 Year YTD Global Market Data 3.00 -2.40 -3.90 -3.20 -6.98 -19.60 GDP Growth (YOY) (%) 3.30 0.10 0.90 1.20 -23.99 -30.61 CPI (YOY) (%) 4.10 2.70 7.60 3.80 -14.38 -22.83 Unemployment (%) 4.25 0.00 0.11 0.25 -17.69 -23.60 Central Bank Rate (Level) 2.64 -0.04 0.42 0.70 0.70 -13.95 10 Year Govt. Yield (%) *Forecasted Q1 2020 1 Year YTD Chart of the Quarter 8.93 3.15 4.98 -3.63 -6.94 -12.68 1.79 -1.88 1 Year YTD -22.31 -23.29 -21.26 -27.30 22.48 3.95 -67.05 -65.55
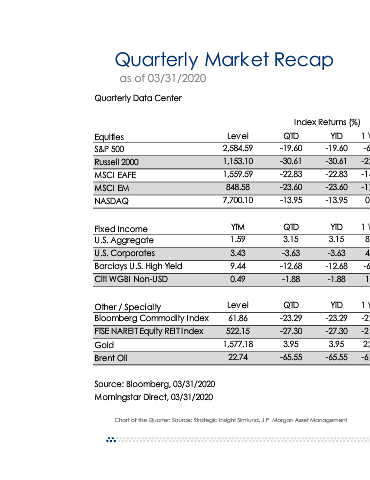
Quarterly Market Recap
QTD -19.60 -30.61 -22.83 -23.60 -13.95 QTD 3.15 -3.63 -12.68 -1.88 QTD -23.29 -27.30 3.95 -65.55
Level 2,584.59 1,153.10 1,559.59 848.58 7,700.10 YTM 1.59 3.43 9.44 0.49 Level 61.86 522.15 1,577.18 22.74 Chart of the Quarter: Source: Strategic Insight Simfund, J.P. Morgan Asset Management.
as of 03/31/2020 Quarterly Data Center Equities S&P 500 Russell 2000 MSCI EAFE MSCI EM NASDAQ Fixed Income U.S. Aggregate U.S. Corporates Barclays U.S. High Yield Citi WGBI Non-USD Other / Specialty Bloomberg Commodity Index FTSE NAREIT Equity REIT Index Gold Brent Oil Source: Bloomberg, 03/31/2020 Morningstar Direct, 03/31/2020